Immigrants from Denmark vs Palestinian Cognitive Disability
COMPARE
Immigrants from Denmark
Palestinian
Cognitive Disability
Cognitive Disability Comparison
Immigrants from Denmark
Palestinians
16.9%
COGNITIVE DISABILITY
96.2/ 100
METRIC RATING
118th/ 347
METRIC RANK
16.8%
COGNITIVE DISABILITY
98.0/ 100
METRIC RATING
104th/ 347
METRIC RANK
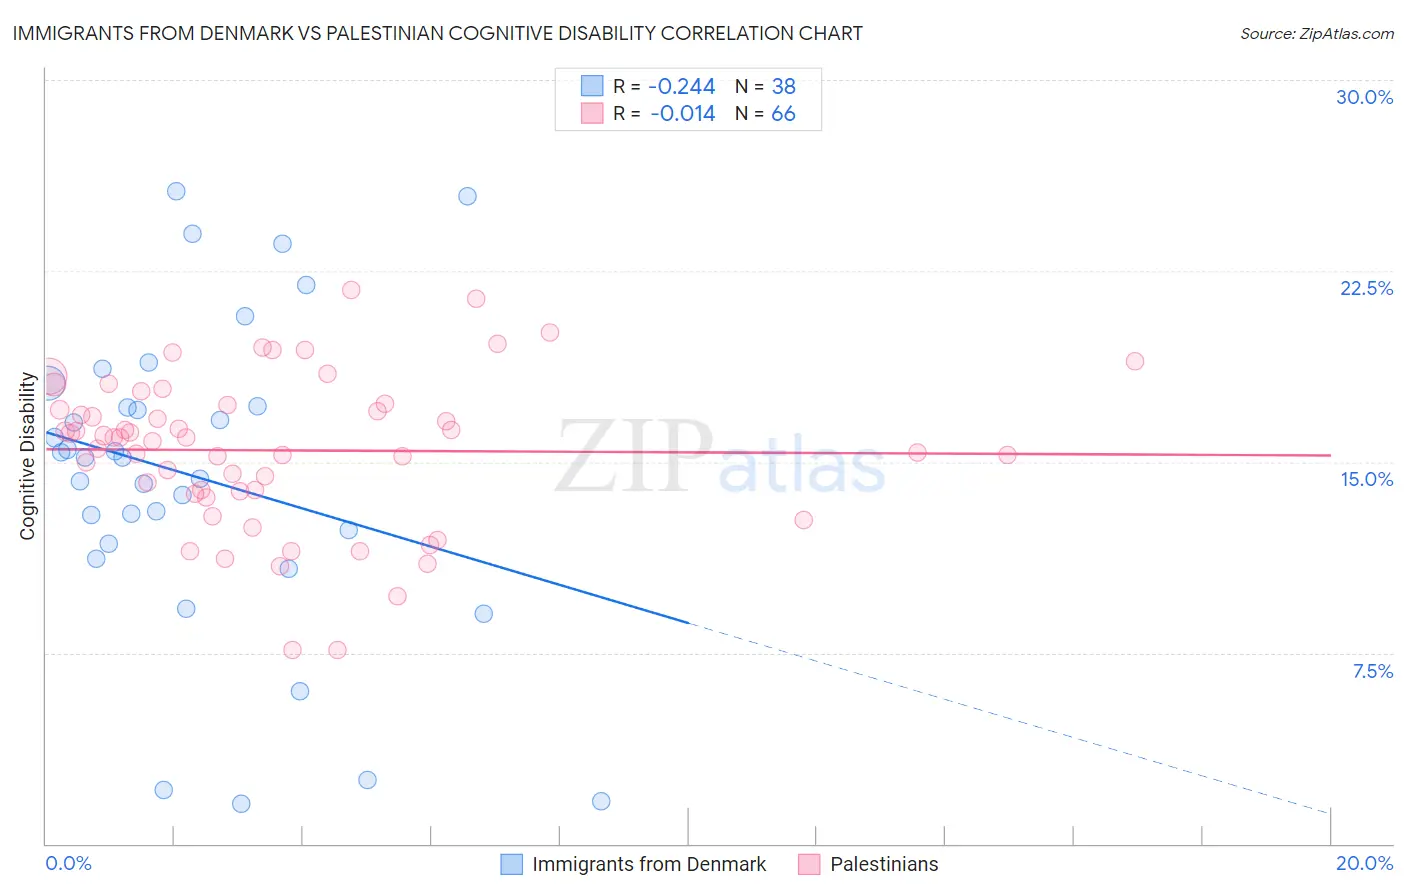
Immigrants from Denmark vs Palestinian Cognitive Disability Correlation Chart
The statistical analysis conducted on geographies consisting of 136,432,525 people shows a weak negative correlation between the proportion of Immigrants from Denmark and percentage of population with cognitive disability in the United States with a correlation coefficient (R) of -0.244 and weighted average of 16.9%. Similarly, the statistical analysis conducted on geographies consisting of 216,464,983 people shows no correlation between the proportion of Palestinians and percentage of population with cognitive disability in the United States with a correlation coefficient (R) of -0.014 and weighted average of 16.8%, a difference of 0.46%.
Cognitive Disability Correlation Summary
| Measurement | Immigrants from Denmark | Palestinian |
| Minimum | 1.6% | 7.6% |
| Maximum | 25.6% | 21.7% |
| Range | 24.1% | 14.1% |
| Mean | 14.4% | 15.5% |
| Median | 15.2% | 16.0% |
| Interquartile 25% (IQ1) | 11.8% | 13.8% |
| Interquartile 75% (IQ3) | 17.2% | 17.3% |
| Interquartile Range (IQR) | 5.4% | 3.4% |
| Standard Deviation (Sample) | 6.1% | 3.0% |
| Standard Deviation (Population) | 6.1% | 3.0% |
Demographics Similar to Immigrants from Denmark and Palestinians by Cognitive Disability
In terms of cognitive disability, the demographic groups most similar to Immigrants from Denmark are Immigrants from Japan (16.9%, a difference of 0.010%), Inupiat (16.9%, a difference of 0.060%), South African (16.9%, a difference of 0.13%), Yup'ik (16.9%, a difference of 0.16%), and Immigrants from Sri Lanka (16.8%, a difference of 0.21%). Similarly, the demographic groups most similar to Palestinians are Paraguayan (16.8%, a difference of 0.0%), Immigrants from Eastern Asia (16.8%, a difference of 0.010%), Irish (16.8%, a difference of 0.050%), Northern European (16.8%, a difference of 0.050%), and Immigrants from Asia (16.8%, a difference of 0.070%).
| Demographics | Rating | Rank | Cognitive Disability |
| Immigrants | Asia | 98.1 /100 | #101 | Exceptional 16.8% |
| Irish | 98.1 /100 | #102 | Exceptional 16.8% |
| Paraguayans | 98.0 /100 | #103 | Exceptional 16.8% |
| Palestinians | 98.0 /100 | #104 | Exceptional 16.8% |
| Immigrants | Eastern Asia | 97.9 /100 | #105 | Exceptional 16.8% |
| Northern Europeans | 97.8 /100 | #106 | Exceptional 16.8% |
| Immigrants | Nicaragua | 97.8 /100 | #107 | Exceptional 16.8% |
| Canadians | 97.5 /100 | #108 | Exceptional 16.8% |
| Albanians | 97.3 /100 | #109 | Exceptional 16.8% |
| Arapaho | 97.3 /100 | #110 | Exceptional 16.8% |
| Uruguayans | 97.2 /100 | #111 | Exceptional 16.8% |
| Indians (Asian) | 97.2 /100 | #112 | Exceptional 16.8% |
| Immigrants | Sri Lanka | 97.1 /100 | #113 | Exceptional 16.8% |
| Koreans | 97.1 /100 | #114 | Exceptional 16.8% |
| Yup'ik | 96.9 /100 | #115 | Exceptional 16.9% |
| Inupiat | 96.5 /100 | #116 | Exceptional 16.9% |
| Immigrants | Japan | 96.2 /100 | #117 | Exceptional 16.9% |
| Immigrants | Denmark | 96.2 /100 | #118 | Exceptional 16.9% |
| South Africans | 95.5 /100 | #119 | Exceptional 16.9% |
| Scottish | 95.0 /100 | #120 | Exceptional 16.9% |
| Immigrants | China | 94.9 /100 | #121 | Exceptional 16.9% |