Cajun vs Palestinian Cognitive Disability
COMPARE
Cajun
Palestinian
Cognitive Disability
Cognitive Disability Comparison
Cajuns
Palestinians
17.8%
COGNITIVE DISABILITY
1.4/ 100
METRIC RATING
239th/ 347
METRIC RANK
16.8%
COGNITIVE DISABILITY
98.0/ 100
METRIC RATING
104th/ 347
METRIC RANK
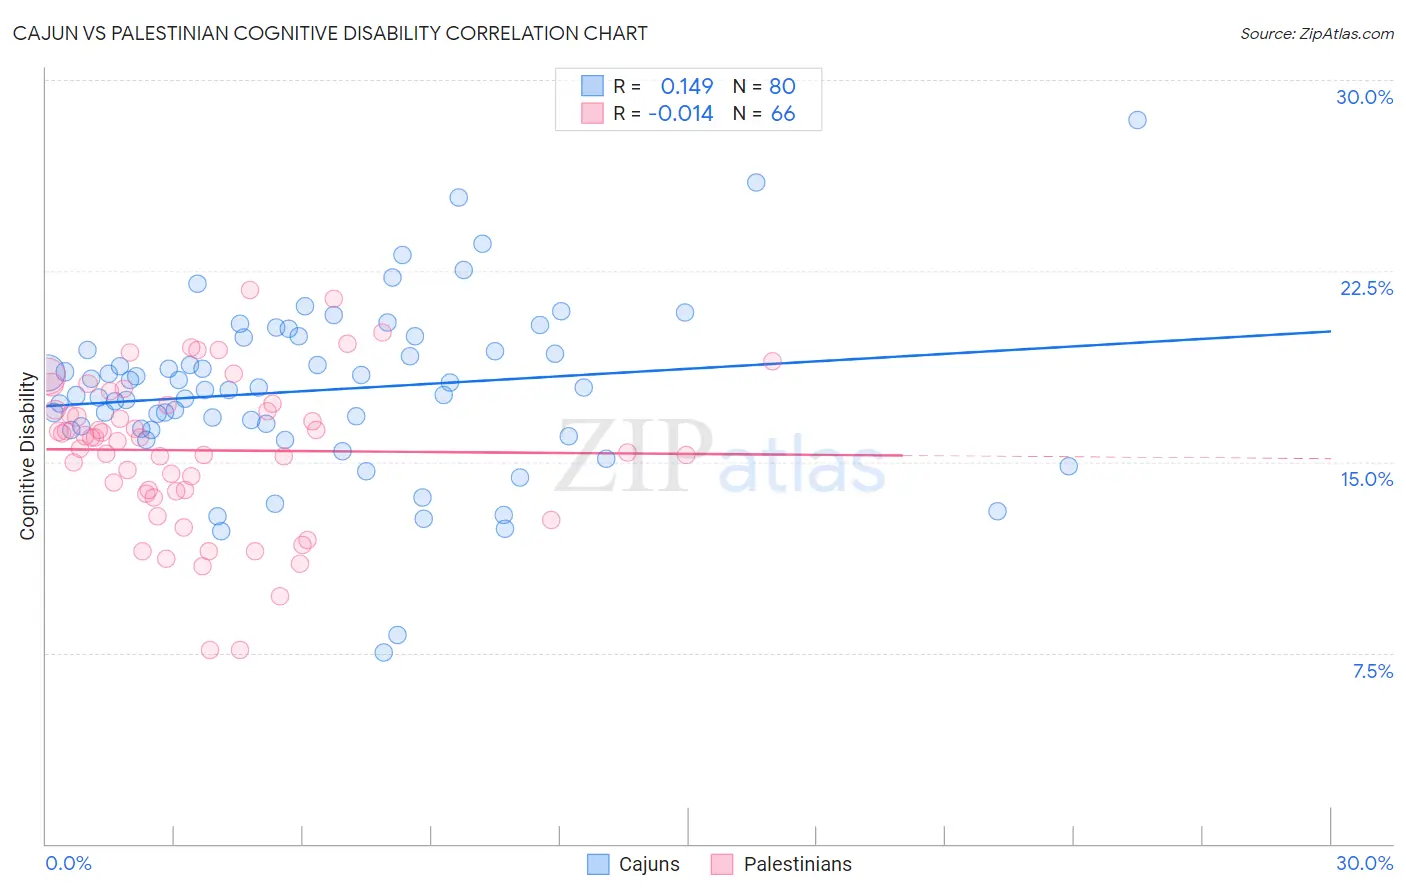
Cajun vs Palestinian Cognitive Disability Correlation Chart
The statistical analysis conducted on geographies consisting of 149,701,580 people shows a poor positive correlation between the proportion of Cajuns and percentage of population with cognitive disability in the United States with a correlation coefficient (R) of 0.149 and weighted average of 17.8%. Similarly, the statistical analysis conducted on geographies consisting of 216,464,983 people shows no correlation between the proportion of Palestinians and percentage of population with cognitive disability in the United States with a correlation coefficient (R) of -0.014 and weighted average of 16.8%, a difference of 5.9%.
Cognitive Disability Correlation Summary
| Measurement | Cajun | Palestinian |
| Minimum | 7.5% | 7.6% |
| Maximum | 28.5% | 21.7% |
| Range | 20.9% | 14.1% |
| Mean | 17.8% | 15.5% |
| Median | 17.9% | 16.0% |
| Interquartile 25% (IQ1) | 16.3% | 13.8% |
| Interquartile 75% (IQ3) | 19.6% | 17.3% |
| Interquartile Range (IQR) | 3.4% | 3.4% |
| Standard Deviation (Sample) | 3.4% | 3.0% |
| Standard Deviation (Population) | 3.4% | 3.0% |
Similar Demographics by Cognitive Disability
Demographics Similar to Cajuns by Cognitive Disability
In terms of cognitive disability, the demographic groups most similar to Cajuns are Iraqi (17.8%, a difference of 0.040%), Cheyenne (17.8%, a difference of 0.13%), Immigrants from Mexico (17.8%, a difference of 0.16%), Immigrants from Iraq (17.8%, a difference of 0.17%), and Mexican (17.8%, a difference of 0.18%).
| Demographics | Rating | Rank | Cognitive Disability |
| Tongans | 2.1 /100 | #232 | Tragic 17.8% |
| Panamanians | 2.1 /100 | #233 | Tragic 17.8% |
| Osage | 2.0 /100 | #234 | Tragic 17.8% |
| Spanish American Indians | 2.0 /100 | #235 | Tragic 17.8% |
| Immigrants | Iraq | 1.8 /100 | #236 | Tragic 17.8% |
| Immigrants | Mexico | 1.8 /100 | #237 | Tragic 17.8% |
| Cheyenne | 1.7 /100 | #238 | Tragic 17.8% |
| Cajuns | 1.4 /100 | #239 | Tragic 17.8% |
| Iraqis | 1.4 /100 | #240 | Tragic 17.8% |
| Mexicans | 1.1 /100 | #241 | Tragic 17.8% |
| Paiute | 1.1 /100 | #242 | Tragic 17.8% |
| Immigrants | Bangladesh | 1.0 /100 | #243 | Tragic 17.8% |
| Jamaicans | 0.9 /100 | #244 | Tragic 17.9% |
| Trinidadians and Tobagonians | 0.8 /100 | #245 | Tragic 17.9% |
| Immigrants | Thailand | 0.8 /100 | #246 | Tragic 17.9% |
Demographics Similar to Palestinians by Cognitive Disability
In terms of cognitive disability, the demographic groups most similar to Palestinians are Paraguayan (16.8%, a difference of 0.0%), Immigrants from Eastern Asia (16.8%, a difference of 0.010%), Irish (16.8%, a difference of 0.050%), Northern European (16.8%, a difference of 0.050%), and Immigrants from Asia (16.8%, a difference of 0.070%).
| Demographics | Rating | Rank | Cognitive Disability |
| Dutch | 98.5 /100 | #97 | Exceptional 16.8% |
| Immigrants | Lebanon | 98.4 /100 | #98 | Exceptional 16.8% |
| Jordanians | 98.2 /100 | #99 | Exceptional 16.8% |
| Immigrants | Russia | 98.2 /100 | #100 | Exceptional 16.8% |
| Immigrants | Asia | 98.1 /100 | #101 | Exceptional 16.8% |
| Irish | 98.1 /100 | #102 | Exceptional 16.8% |
| Paraguayans | 98.0 /100 | #103 | Exceptional 16.8% |
| Palestinians | 98.0 /100 | #104 | Exceptional 16.8% |
| Immigrants | Eastern Asia | 97.9 /100 | #105 | Exceptional 16.8% |
| Northern Europeans | 97.8 /100 | #106 | Exceptional 16.8% |
| Immigrants | Nicaragua | 97.8 /100 | #107 | Exceptional 16.8% |
| Canadians | 97.5 /100 | #108 | Exceptional 16.8% |
| Albanians | 97.3 /100 | #109 | Exceptional 16.8% |
| Arapaho | 97.3 /100 | #110 | Exceptional 16.8% |
| Uruguayans | 97.2 /100 | #111 | Exceptional 16.8% |