Pueblo vs European Vision Disability
COMPARE
Pueblo
European
Vision Disability
Vision Disability Comparison
Pueblo
Europeans
3.3%
VISION DISABILITY
0.0/ 100
METRIC RATING
344th/ 347
METRIC RANK
2.2%
VISION DISABILITY
25.7/ 100
METRIC RATING
192nd/ 347
METRIC RANK
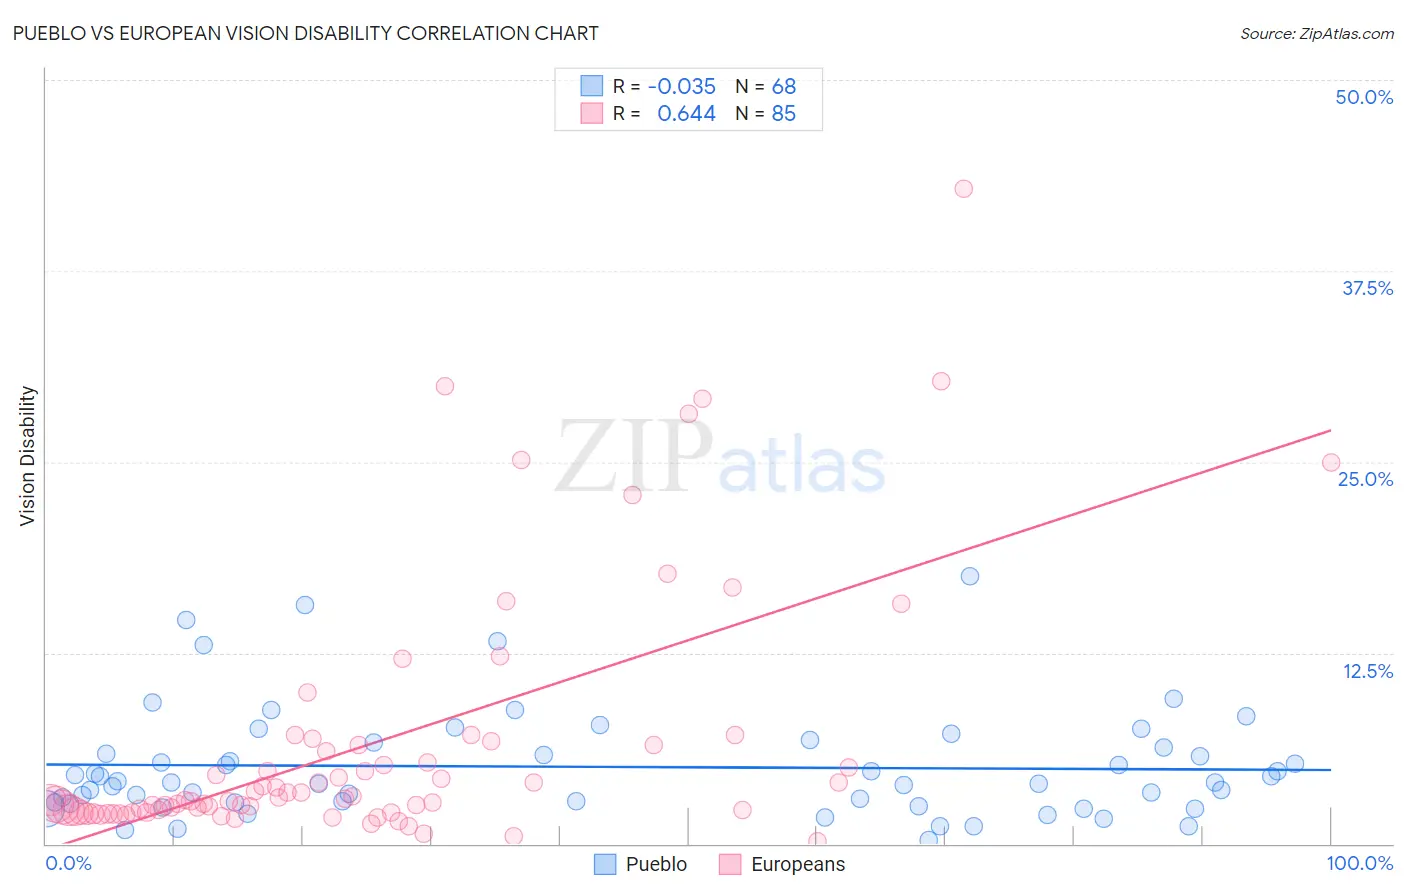
Pueblo vs European Vision Disability Correlation Chart
The statistical analysis conducted on geographies consisting of 120,045,963 people shows no correlation between the proportion of Pueblo and percentage of population with vision disability in the United States with a correlation coefficient (R) of -0.035 and weighted average of 3.3%. Similarly, the statistical analysis conducted on geographies consisting of 560,182,273 people shows a significant positive correlation between the proportion of Europeans and percentage of population with vision disability in the United States with a correlation coefficient (R) of 0.644 and weighted average of 2.2%, a difference of 51.3%.
Vision Disability Correlation Summary
| Measurement | Pueblo | European |
| Minimum | 0.28% | 0.14% |
| Maximum | 17.5% | 42.9% |
| Range | 17.3% | 42.7% |
| Mean | 5.0% | 6.5% |
| Median | 4.0% | 2.9% |
| Interquartile 25% (IQ1) | 2.7% | 2.1% |
| Interquartile 75% (IQ3) | 6.5% | 6.5% |
| Interquartile Range (IQR) | 3.8% | 4.4% |
| Standard Deviation (Sample) | 3.6% | 8.3% |
| Standard Deviation (Population) | 3.5% | 8.3% |
Similar Demographics by Vision Disability
Demographics Similar to Pueblo by Vision Disability
In terms of vision disability, the demographic groups most similar to Pueblo are Pima (3.3%, a difference of 0.030%), Choctaw (3.3%, a difference of 1.1%), Lumbee (3.4%, a difference of 1.6%), Kiowa (3.3%, a difference of 2.5%), and Houma (3.4%, a difference of 3.3%).
| Demographics | Rating | Rank | Vision Disability |
| Cajuns | 0.0 /100 | #333 | Tragic 3.1% |
| Cheyenne | 0.0 /100 | #334 | Tragic 3.1% |
| Navajo | 0.0 /100 | #335 | Tragic 3.1% |
| Alaskan Athabascans | 0.0 /100 | #336 | Tragic 3.1% |
| Dutch West Indians | 0.0 /100 | #337 | Tragic 3.2% |
| Chickasaw | 0.0 /100 | #338 | Tragic 3.2% |
| Tsimshian | 0.0 /100 | #339 | Tragic 3.2% |
| Creek | 0.0 /100 | #340 | Tragic 3.2% |
| Kiowa | 0.0 /100 | #341 | Tragic 3.3% |
| Choctaw | 0.0 /100 | #342 | Tragic 3.3% |
| Pima | 0.0 /100 | #343 | Tragic 3.3% |
| Pueblo | 0.0 /100 | #344 | Tragic 3.3% |
| Lumbee | 0.0 /100 | #345 | Tragic 3.4% |
| Houma | 0.0 /100 | #346 | Tragic 3.4% |
| Puerto Ricans | 0.0 /100 | #347 | Tragic 3.9% |
Demographics Similar to Europeans by Vision Disability
In terms of vision disability, the demographic groups most similar to Europeans are Canadian (2.2%, a difference of 0.010%), Immigrants from Costa Rica (2.2%, a difference of 0.030%), British (2.2%, a difference of 0.050%), Salvadoran (2.2%, a difference of 0.13%), and Immigrants from Barbados (2.2%, a difference of 0.15%).
| Demographics | Rating | Rank | Vision Disability |
| Immigrants | Middle Africa | 33.5 /100 | #185 | Fair 2.2% |
| Native Hawaiians | 33.3 /100 | #186 | Fair 2.2% |
| Immigrants | St. Vincent and the Grenadines | 30.3 /100 | #187 | Fair 2.2% |
| Guyanese | 28.9 /100 | #188 | Fair 2.2% |
| Salvadorans | 27.4 /100 | #189 | Fair 2.2% |
| Immigrants | Costa Rica | 26.1 /100 | #190 | Fair 2.2% |
| Canadians | 25.8 /100 | #191 | Fair 2.2% |
| Europeans | 25.7 /100 | #192 | Fair 2.2% |
| British | 25.1 /100 | #193 | Fair 2.2% |
| Immigrants | Barbados | 24.0 /100 | #194 | Fair 2.2% |
| Immigrants | Immigrants | 23.7 /100 | #195 | Fair 2.2% |
| Immigrants | Grenada | 23.1 /100 | #196 | Fair 2.2% |
| Ghanaians | 21.8 /100 | #197 | Fair 2.2% |
| Czechoslovakians | 21.6 /100 | #198 | Fair 2.2% |
| Immigrants | El Salvador | 21.0 /100 | #199 | Fair 2.2% |