Pueblo vs European Child Poverty Under the Age of 16
COMPARE
Pueblo
European
Child Poverty Under the Age of 16
Child Poverty Under the Age of 16 Comparison
Pueblo
Europeans
23.9%
CHILD POVERTY UNDER THE AGE OF 16
0.0/ 100
METRIC RATING
332nd/ 347
METRIC RANK
14.3%
CHILD POVERTY UNDER THE AGE OF 16
98.1/ 100
METRIC RATING
67th/ 347
METRIC RANK
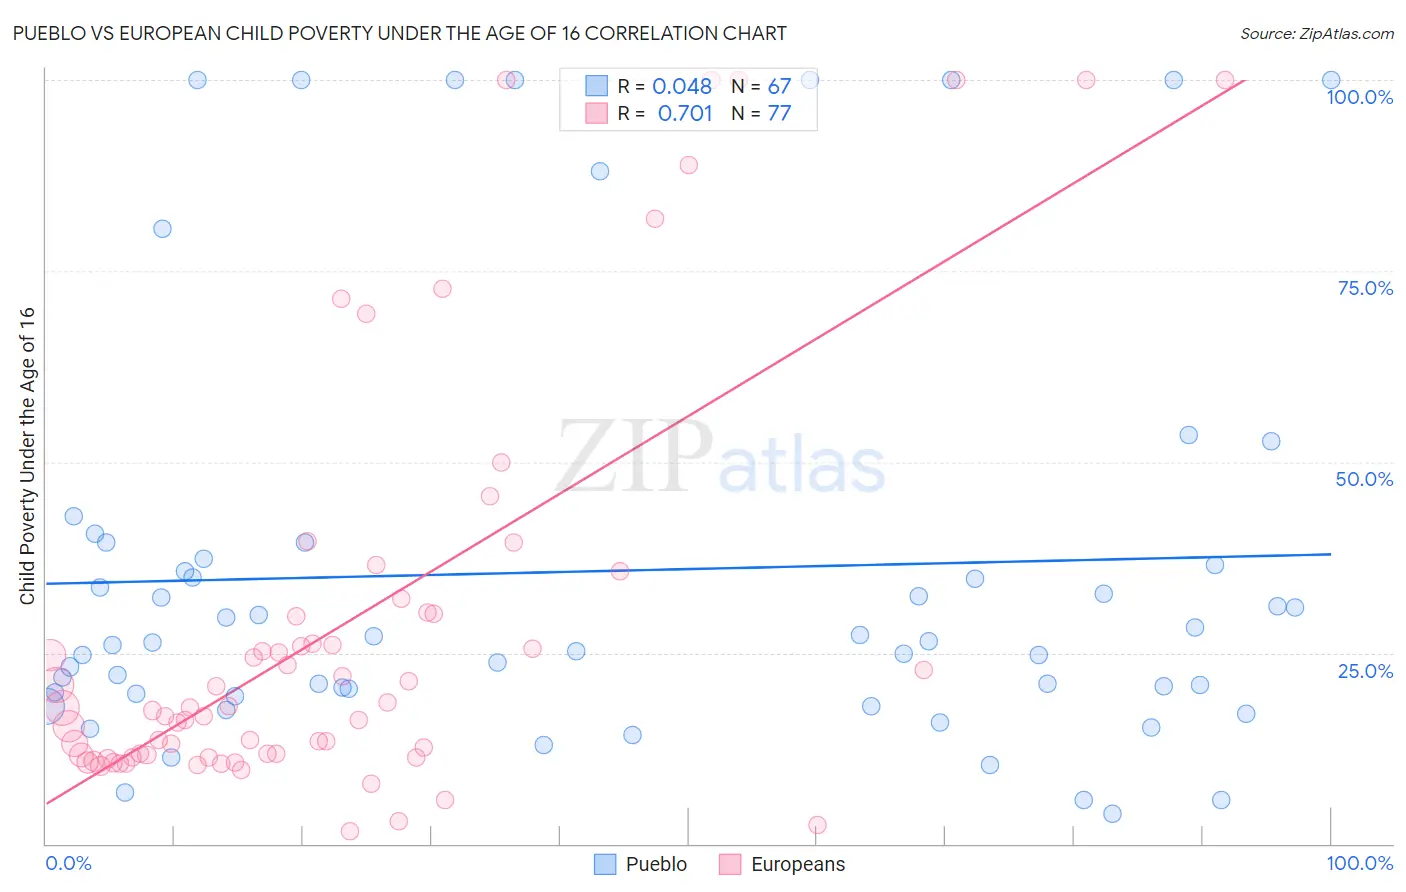
Pueblo vs European Child Poverty Under the Age of 16 Correlation Chart
The statistical analysis conducted on geographies consisting of 119,831,581 people shows no correlation between the proportion of Pueblo and poverty level among children under the age of 16 in the United States with a correlation coefficient (R) of 0.048 and weighted average of 23.9%. Similarly, the statistical analysis conducted on geographies consisting of 550,263,895 people shows a strong positive correlation between the proportion of Europeans and poverty level among children under the age of 16 in the United States with a correlation coefficient (R) of 0.701 and weighted average of 14.3%, a difference of 67.4%.
Child Poverty Under the Age of 16 Correlation Summary
| Measurement | Pueblo | European |
| Minimum | 4.0% | 1.6% |
| Maximum | 100.0% | 100.0% |
| Range | 96.0% | 98.4% |
| Mean | 35.7% | 28.5% |
| Median | 26.3% | 17.8% |
| Interquartile 25% (IQ1) | 19.7% | 11.5% |
| Interquartile 75% (IQ3) | 37.3% | 30.2% |
| Interquartile Range (IQR) | 17.6% | 18.8% |
| Standard Deviation (Sample) | 27.8% | 27.2% |
| Standard Deviation (Population) | 27.5% | 27.0% |
Similar Demographics by Child Poverty Under the Age of 16
Demographics Similar to Pueblo by Child Poverty Under the Age of 16
In terms of child poverty under the age of 16, the demographic groups most similar to Pueblo are Immigrants from Dominican Republic (24.0%, a difference of 0.17%), Apache (23.8%, a difference of 0.38%), Native/Alaskan (23.8%, a difference of 0.60%), Dominican (23.8%, a difference of 0.69%), and Black/African American (24.4%, a difference of 2.1%).
| Demographics | Rating | Rank | Child Poverty Under the Age of 16 |
| Immigrants | Congo | 0.0 /100 | #325 | Tragic 22.5% |
| Immigrants | Honduras | 0.0 /100 | #326 | Tragic 22.7% |
| Menominee | 0.0 /100 | #327 | Tragic 23.0% |
| Colville | 0.0 /100 | #328 | Tragic 23.0% |
| Dominicans | 0.0 /100 | #329 | Tragic 23.8% |
| Natives/Alaskans | 0.0 /100 | #330 | Tragic 23.8% |
| Apache | 0.0 /100 | #331 | Tragic 23.8% |
| Pueblo | 0.0 /100 | #332 | Tragic 23.9% |
| Immigrants | Dominican Republic | 0.0 /100 | #333 | Tragic 24.0% |
| Blacks/African Americans | 0.0 /100 | #334 | Tragic 24.4% |
| Houma | 0.0 /100 | #335 | Tragic 24.9% |
| Yup'ik | 0.0 /100 | #336 | Tragic 25.1% |
| Sioux | 0.0 /100 | #337 | Tragic 25.2% |
| Cheyenne | 0.0 /100 | #338 | Tragic 25.4% |
| Crow | 0.0 /100 | #339 | Tragic 26.0% |
Demographics Similar to Europeans by Child Poverty Under the Age of 16
In terms of child poverty under the age of 16, the demographic groups most similar to Europeans are Slovene (14.3%, a difference of 0.030%), Laotian (14.3%, a difference of 0.10%), Immigrants from Bulgaria (14.3%, a difference of 0.18%), Immigrants from Philippines (14.3%, a difference of 0.21%), and Immigrants from Netherlands (14.3%, a difference of 0.28%).
| Demographics | Rating | Rank | Child Poverty Under the Age of 16 |
| Immigrants | Austria | 98.5 /100 | #60 | Exceptional 14.2% |
| Immigrants | Sweden | 98.5 /100 | #61 | Exceptional 14.2% |
| Zimbabweans | 98.5 /100 | #62 | Exceptional 14.2% |
| Immigrants | Europe | 98.4 /100 | #63 | Exceptional 14.2% |
| Immigrants | Romania | 98.3 /100 | #64 | Exceptional 14.2% |
| Immigrants | Philippines | 98.2 /100 | #65 | Exceptional 14.3% |
| Slovenes | 98.1 /100 | #66 | Exceptional 14.3% |
| Europeans | 98.1 /100 | #67 | Exceptional 14.3% |
| Laotians | 98.0 /100 | #68 | Exceptional 14.3% |
| Immigrants | Bulgaria | 98.0 /100 | #69 | Exceptional 14.3% |
| Immigrants | Netherlands | 97.9 /100 | #70 | Exceptional 14.3% |
| Immigrants | Poland | 97.9 /100 | #71 | Exceptional 14.3% |
| Cambodians | 97.8 /100 | #72 | Exceptional 14.4% |
| Immigrants | Turkey | 97.6 /100 | #73 | Exceptional 14.4% |
| Macedonians | 97.6 /100 | #74 | Exceptional 14.4% |