Pueblo vs European Male Disability
COMPARE
Pueblo
European
Male Disability
Male Disability Comparison
Pueblo
Europeans
15.0%
MALE DISABILITY
0.0/ 100
METRIC RATING
338th/ 347
METRIC RANK
12.1%
MALE DISABILITY
0.3/ 100
METRIC RATING
257th/ 347
METRIC RANK
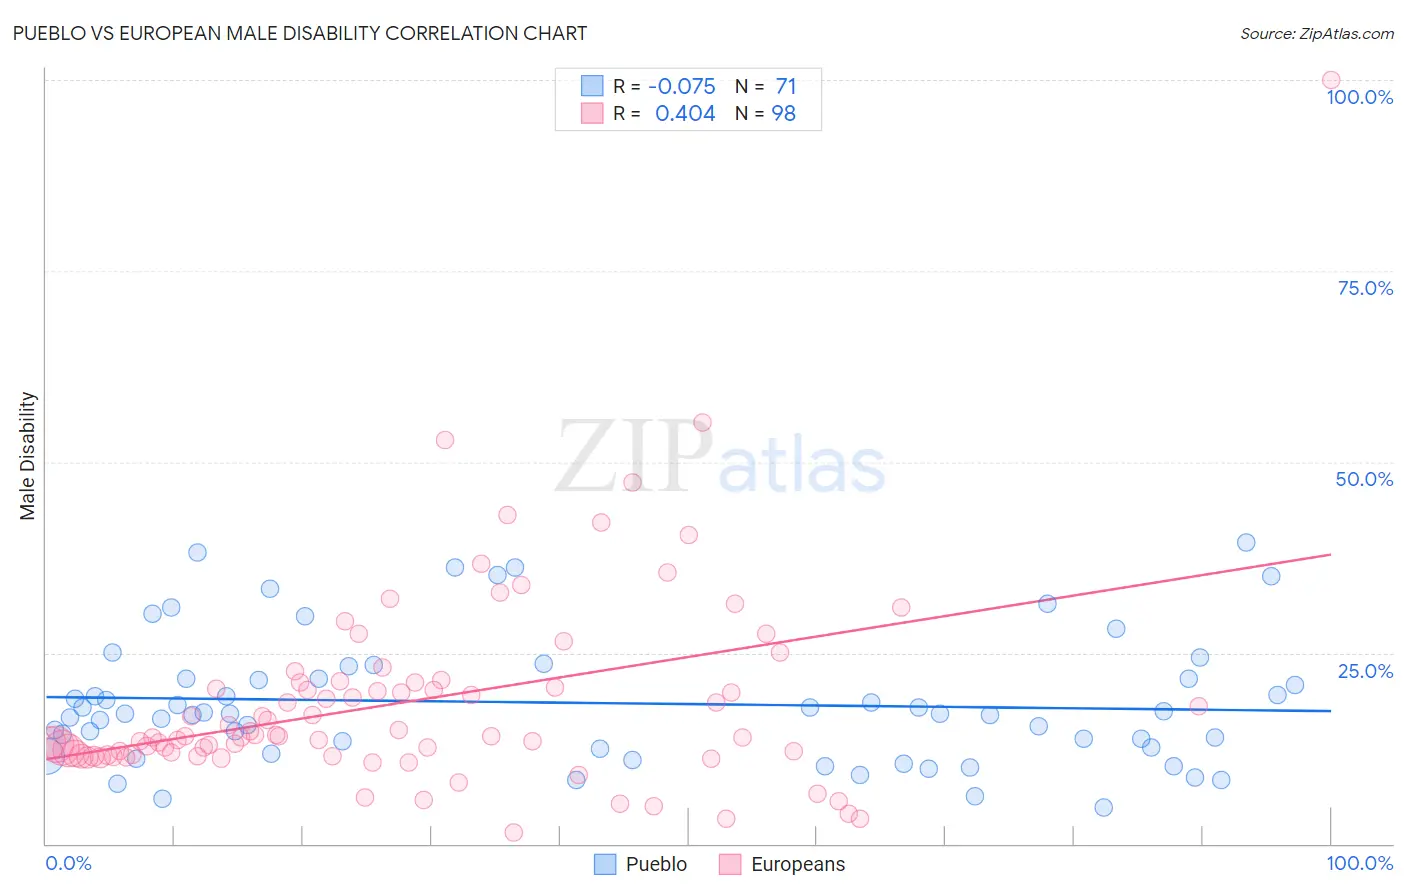
Pueblo vs European Male Disability Correlation Chart
The statistical analysis conducted on geographies consisting of 120,077,979 people shows a slight negative correlation between the proportion of Pueblo and percentage of males with a disability in the United States with a correlation coefficient (R) of -0.075 and weighted average of 15.0%. Similarly, the statistical analysis conducted on geographies consisting of 561,596,268 people shows a moderate positive correlation between the proportion of Europeans and percentage of males with a disability in the United States with a correlation coefficient (R) of 0.404 and weighted average of 12.1%, a difference of 24.0%.
Male Disability Correlation Summary
| Measurement | Pueblo | European |
| Minimum | 4.7% | 1.4% |
| Maximum | 39.5% | 100.0% |
| Range | 34.8% | 98.6% |
| Mean | 18.4% | 18.6% |
| Median | 17.1% | 14.0% |
| Interquartile 25% (IQ1) | 12.4% | 11.6% |
| Interquartile 75% (IQ3) | 21.7% | 21.1% |
| Interquartile Range (IQR) | 9.2% | 9.4% |
| Standard Deviation (Sample) | 8.4% | 13.4% |
| Standard Deviation (Population) | 8.3% | 13.3% |
Similar Demographics by Male Disability
Demographics Similar to Pueblo by Male Disability
In terms of male disability, the demographic groups most similar to Pueblo are Menominee (15.0%, a difference of 0.11%), Alaskan Athabascan (14.9%, a difference of 0.62%), Chickasaw (15.1%, a difference of 0.80%), Dutch West Indian (14.8%, a difference of 1.1%), and Cherokee (14.8%, a difference of 1.1%).
| Demographics | Rating | Rank | Male Disability |
| Tohono O'odham | 0.0 /100 | #331 | Tragic 14.6% |
| Seminole | 0.0 /100 | #332 | Tragic 14.7% |
| Yuman | 0.0 /100 | #333 | Tragic 14.7% |
| Cherokee | 0.0 /100 | #334 | Tragic 14.8% |
| Dutch West Indians | 0.0 /100 | #335 | Tragic 14.8% |
| Alaskan Athabascans | 0.0 /100 | #336 | Tragic 14.9% |
| Menominee | 0.0 /100 | #337 | Tragic 15.0% |
| Pueblo | 0.0 /100 | #338 | Tragic 15.0% |
| Chickasaw | 0.0 /100 | #339 | Tragic 15.1% |
| Lumbee | 0.0 /100 | #340 | Tragic 15.2% |
| Choctaw | 0.0 /100 | #341 | Tragic 15.4% |
| Kiowa | 0.0 /100 | #342 | Tragic 15.4% |
| Creek | 0.0 /100 | #343 | Tragic 15.5% |
| Puerto Ricans | 0.0 /100 | #344 | Tragic 15.6% |
| Tsimshian | 0.0 /100 | #345 | Tragic 15.6% |
Demographics Similar to Europeans by Male Disability
In terms of male disability, the demographic groups most similar to Europeans are Swiss (12.1%, a difference of 0.0%), Basque (12.1%, a difference of 0.19%), Belgian (12.1%, a difference of 0.24%), Chinese (12.1%, a difference of 0.25%), and British (12.1%, a difference of 0.26%).
| Demographics | Rating | Rank | Male Disability |
| Bangladeshis | 0.5 /100 | #250 | Tragic 12.0% |
| German Russians | 0.5 /100 | #251 | Tragic 12.0% |
| Slovenes | 0.5 /100 | #252 | Tragic 12.0% |
| Guamanians/Chamorros | 0.5 /100 | #253 | Tragic 12.0% |
| British | 0.4 /100 | #254 | Tragic 12.1% |
| Chinese | 0.4 /100 | #255 | Tragic 12.1% |
| Swiss | 0.3 /100 | #256 | Tragic 12.1% |
| Europeans | 0.3 /100 | #257 | Tragic 12.1% |
| Basques | 0.3 /100 | #258 | Tragic 12.1% |
| Belgians | 0.3 /100 | #259 | Tragic 12.1% |
| Swedes | 0.3 /100 | #260 | Tragic 12.1% |
| Slavs | 0.2 /100 | #261 | Tragic 12.2% |
| Norwegians | 0.2 /100 | #262 | Tragic 12.2% |
| Canadians | 0.2 /100 | #263 | Tragic 12.2% |
| Nepalese | 0.2 /100 | #264 | Tragic 12.2% |