Pueblo vs Cherokee Vision Disability
COMPARE
Pueblo
Cherokee
Vision Disability
Vision Disability Comparison
Pueblo
Cherokee
3.3%
VISION DISABILITY
0.0/ 100
METRIC RATING
344th/ 347
METRIC RANK
2.9%
VISION DISABILITY
0.0/ 100
METRIC RATING
325th/ 347
METRIC RANK
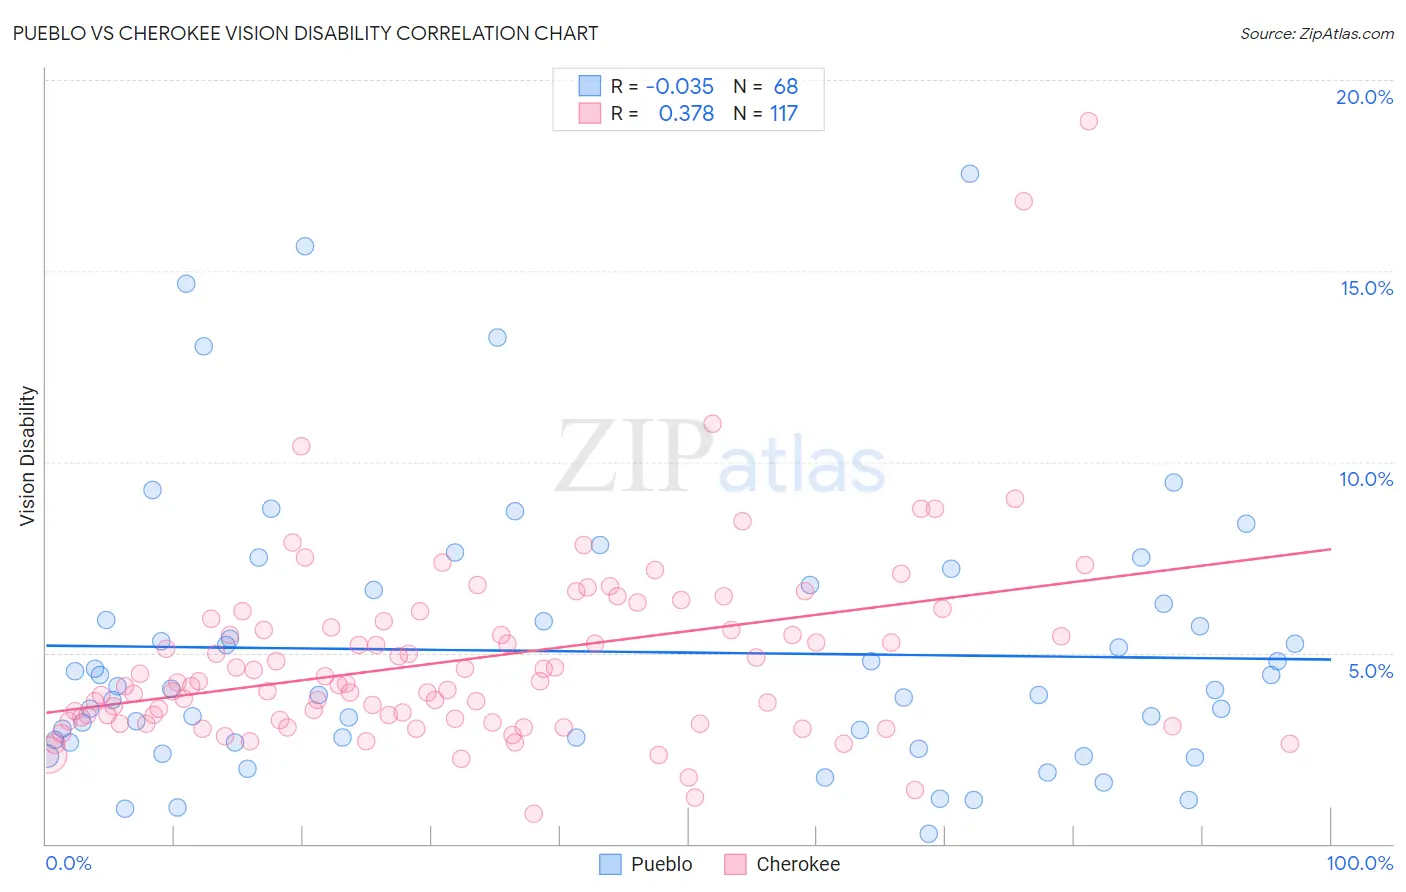
Pueblo vs Cherokee Vision Disability Correlation Chart
The statistical analysis conducted on geographies consisting of 120,045,963 people shows no correlation between the proportion of Pueblo and percentage of population with vision disability in the United States with a correlation coefficient (R) of -0.035 and weighted average of 3.3%. Similarly, the statistical analysis conducted on geographies consisting of 493,069,891 people shows a mild positive correlation between the proportion of Cherokee and percentage of population with vision disability in the United States with a correlation coefficient (R) of 0.378 and weighted average of 2.9%, a difference of 14.5%.
Vision Disability Correlation Summary
| Measurement | Pueblo | Cherokee |
| Minimum | 0.28% | 0.78% |
| Maximum | 17.5% | 18.9% |
| Range | 17.3% | 18.1% |
| Mean | 5.0% | 4.8% |
| Median | 4.0% | 4.2% |
| Interquartile 25% (IQ1) | 2.7% | 3.2% |
| Interquartile 75% (IQ3) | 6.5% | 5.8% |
| Interquartile Range (IQR) | 3.8% | 2.5% |
| Standard Deviation (Sample) | 3.6% | 2.5% |
| Standard Deviation (Population) | 3.5% | 2.5% |
Demographics Similar to Pueblo and Cherokee by Vision Disability
In terms of vision disability, the demographic groups most similar to Pueblo are Pima (3.3%, a difference of 0.030%), Choctaw (3.3%, a difference of 1.1%), Kiowa (3.3%, a difference of 2.5%), Creek (3.2%, a difference of 4.0%), and Tsimshian (3.2%, a difference of 4.1%). Similarly, the demographic groups most similar to Cherokee are Hopi (2.9%, a difference of 0.010%), Spanish American (2.9%, a difference of 1.2%), Native/Alaskan (3.0%, a difference of 2.0%), Yuman (3.0%, a difference of 2.5%), and Apache (3.0%, a difference of 2.7%).
| Demographics | Rating | Rank | Vision Disability |
| Hopi | 0.0 /100 | #324 | Tragic 2.9% |
| Cherokee | 0.0 /100 | #325 | Tragic 2.9% |
| Spanish Americans | 0.0 /100 | #326 | Tragic 2.9% |
| Natives/Alaskans | 0.0 /100 | #327 | Tragic 3.0% |
| Yuman | 0.0 /100 | #328 | Tragic 3.0% |
| Apache | 0.0 /100 | #329 | Tragic 3.0% |
| Colville | 0.0 /100 | #330 | Tragic 3.0% |
| Central American Indians | 0.0 /100 | #331 | Tragic 3.0% |
| Seminole | 0.0 /100 | #332 | Tragic 3.1% |
| Cajuns | 0.0 /100 | #333 | Tragic 3.1% |
| Cheyenne | 0.0 /100 | #334 | Tragic 3.1% |
| Navajo | 0.0 /100 | #335 | Tragic 3.1% |
| Alaskan Athabascans | 0.0 /100 | #336 | Tragic 3.1% |
| Dutch West Indians | 0.0 /100 | #337 | Tragic 3.2% |
| Chickasaw | 0.0 /100 | #338 | Tragic 3.2% |
| Tsimshian | 0.0 /100 | #339 | Tragic 3.2% |
| Creek | 0.0 /100 | #340 | Tragic 3.2% |
| Kiowa | 0.0 /100 | #341 | Tragic 3.3% |
| Choctaw | 0.0 /100 | #342 | Tragic 3.3% |
| Pima | 0.0 /100 | #343 | Tragic 3.3% |
| Pueblo | 0.0 /100 | #344 | Tragic 3.3% |