Spanish American vs Soviet Union Ambulatory Disability
COMPARE
Spanish American
Soviet Union
Ambulatory Disability
Ambulatory Disability Comparison
Spanish Americans
Soviet Union
7.1%
AMBULATORY DISABILITY
0.0/ 100
METRIC RATING
307th/ 347
METRIC RANK
5.8%
AMBULATORY DISABILITY
98.9/ 100
METRIC RATING
88th/ 347
METRIC RANK
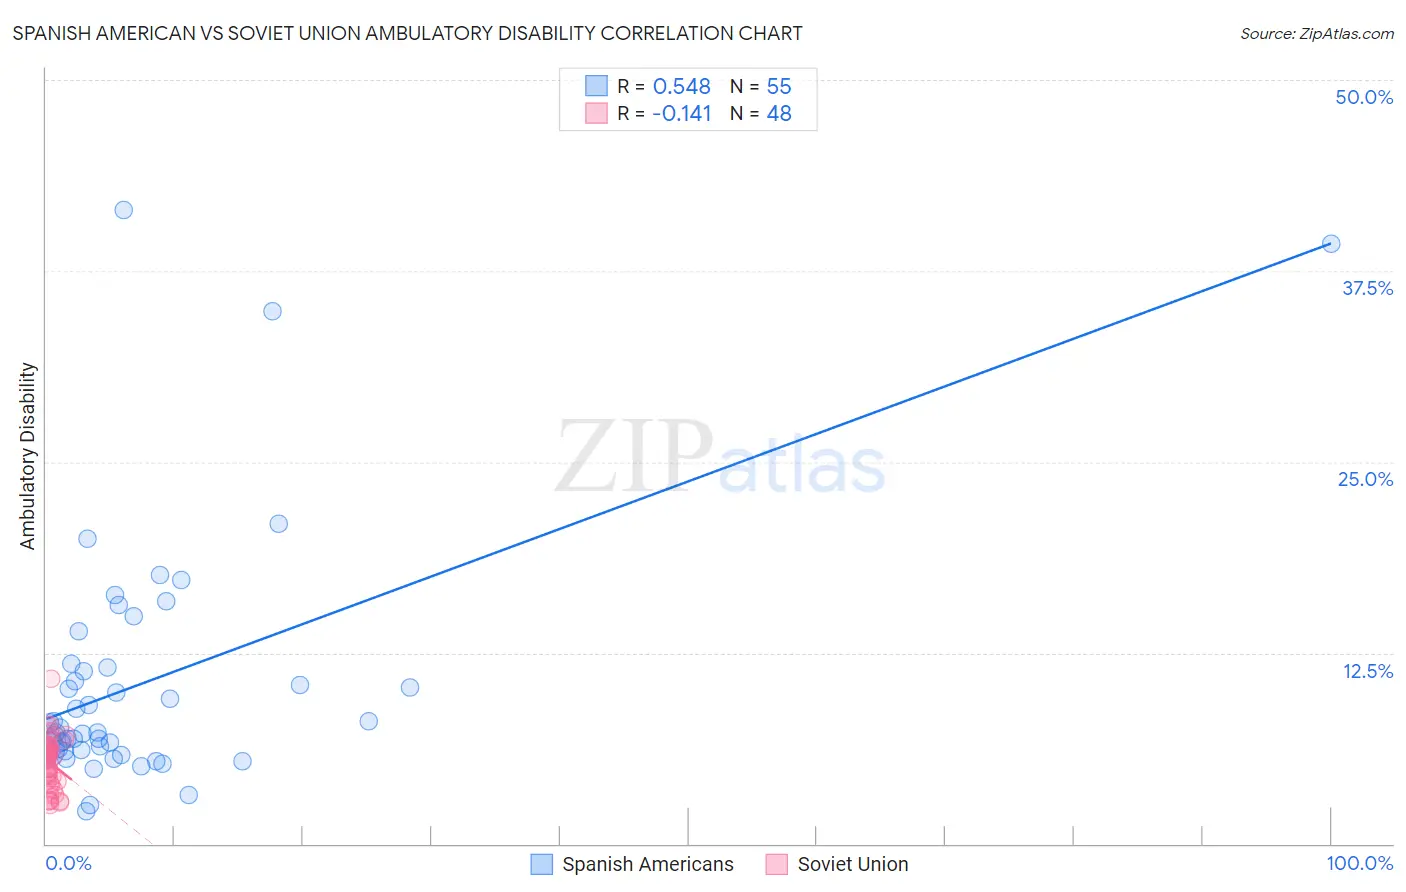
Spanish American vs Soviet Union Ambulatory Disability Correlation Chart
The statistical analysis conducted on geographies consisting of 103,166,807 people shows a substantial positive correlation between the proportion of Spanish Americans and percentage of population with ambulatory disability in the United States with a correlation coefficient (R) of 0.548 and weighted average of 7.1%. Similarly, the statistical analysis conducted on geographies consisting of 43,487,843 people shows a poor negative correlation between the proportion of Soviet Union and percentage of population with ambulatory disability in the United States with a correlation coefficient (R) of -0.141 and weighted average of 5.8%, a difference of 22.9%.
Ambulatory Disability Correlation Summary
| Measurement | Spanish American | Soviet Union |
| Minimum | 2.1% | 2.6% |
| Maximum | 41.5% | 10.8% |
| Range | 39.4% | 8.2% |
| Mean | 10.5% | 5.3% |
| Median | 7.3% | 5.7% |
| Interquartile 25% (IQ1) | 6.1% | 4.1% |
| Interquartile 75% (IQ3) | 11.5% | 6.3% |
| Interquartile Range (IQR) | 5.4% | 2.3% |
| Standard Deviation (Sample) | 8.0% | 1.7% |
| Standard Deviation (Population) | 8.0% | 1.6% |
Similar Demographics by Ambulatory Disability
Demographics Similar to Spanish Americans by Ambulatory Disability
In terms of ambulatory disability, the demographic groups most similar to Spanish Americans are Chippewa (7.1%, a difference of 0.0%), Immigrants from the Azores (7.1%, a difference of 0.17%), Iroquois (7.1%, a difference of 0.26%), Arapaho (7.1%, a difference of 0.45%), and Cree (7.1%, a difference of 0.46%).
| Demographics | Rating | Rank | Ambulatory Disability |
| Marshallese | 0.0 /100 | #300 | Tragic 6.9% |
| British West Indians | 0.0 /100 | #301 | Tragic 7.0% |
| Immigrants | Armenia | 0.0 /100 | #302 | Tragic 7.0% |
| Africans | 0.0 /100 | #303 | Tragic 7.0% |
| Immigrants | Cabo Verde | 0.0 /100 | #304 | Tragic 7.0% |
| Immigrants | Micronesia | 0.0 /100 | #305 | Tragic 7.0% |
| Iroquois | 0.0 /100 | #306 | Tragic 7.1% |
| Spanish Americans | 0.0 /100 | #307 | Tragic 7.1% |
| Chippewa | 0.0 /100 | #308 | Tragic 7.1% |
| Immigrants | Azores | 0.0 /100 | #309 | Tragic 7.1% |
| Arapaho | 0.0 /100 | #310 | Tragic 7.1% |
| Cree | 0.0 /100 | #311 | Tragic 7.1% |
| Delaware | 0.0 /100 | #312 | Tragic 7.1% |
| Immigrants | Yemen | 0.0 /100 | #313 | Tragic 7.1% |
| Blackfeet | 0.0 /100 | #314 | Tragic 7.1% |
Demographics Similar to Soviet Union by Ambulatory Disability
In terms of ambulatory disability, the demographic groups most similar to Soviet Union are Immigrants from Chile (5.8%, a difference of 0.040%), Latvian (5.7%, a difference of 0.11%), Bhutanese (5.8%, a difference of 0.12%), Australian (5.8%, a difference of 0.12%), and Immigrants from Sudan (5.8%, a difference of 0.12%).
| Demographics | Rating | Rank | Ambulatory Disability |
| Immigrants | Jordan | 99.2 /100 | #81 | Exceptional 5.7% |
| Palestinians | 99.2 /100 | #82 | Exceptional 5.7% |
| Eastern Europeans | 99.2 /100 | #83 | Exceptional 5.7% |
| Ugandans | 99.2 /100 | #84 | Exceptional 5.7% |
| South Americans | 99.0 /100 | #85 | Exceptional 5.7% |
| Latvians | 99.0 /100 | #86 | Exceptional 5.7% |
| Immigrants | Chile | 98.9 /100 | #87 | Exceptional 5.8% |
| Soviet Union | 98.9 /100 | #88 | Exceptional 5.8% |
| Bhutanese | 98.8 /100 | #89 | Exceptional 5.8% |
| Australians | 98.8 /100 | #90 | Exceptional 5.8% |
| Immigrants | Sudan | 98.8 /100 | #91 | Exceptional 5.8% |
| Immigrants | Sierra Leone | 98.6 /100 | #92 | Exceptional 5.8% |
| Immigrants | Denmark | 98.6 /100 | #93 | Exceptional 5.8% |
| Kenyans | 98.4 /100 | #94 | Exceptional 5.8% |
| Immigrants | El Salvador | 98.4 /100 | #95 | Exceptional 5.8% |