Immigrants from Hong Kong vs Crow Cognitive Disability
COMPARE
Immigrants from Hong Kong
Crow
Cognitive Disability
Cognitive Disability Comparison
Immigrants from Hong Kong
Crow
16.0%
COGNITIVE DISABILITY
100.0/ 100
METRIC RATING
5th/ 347
METRIC RANK
17.3%
COGNITIVE DISABILITY
39.1/ 100
METRIC RATING
184th/ 347
METRIC RANK
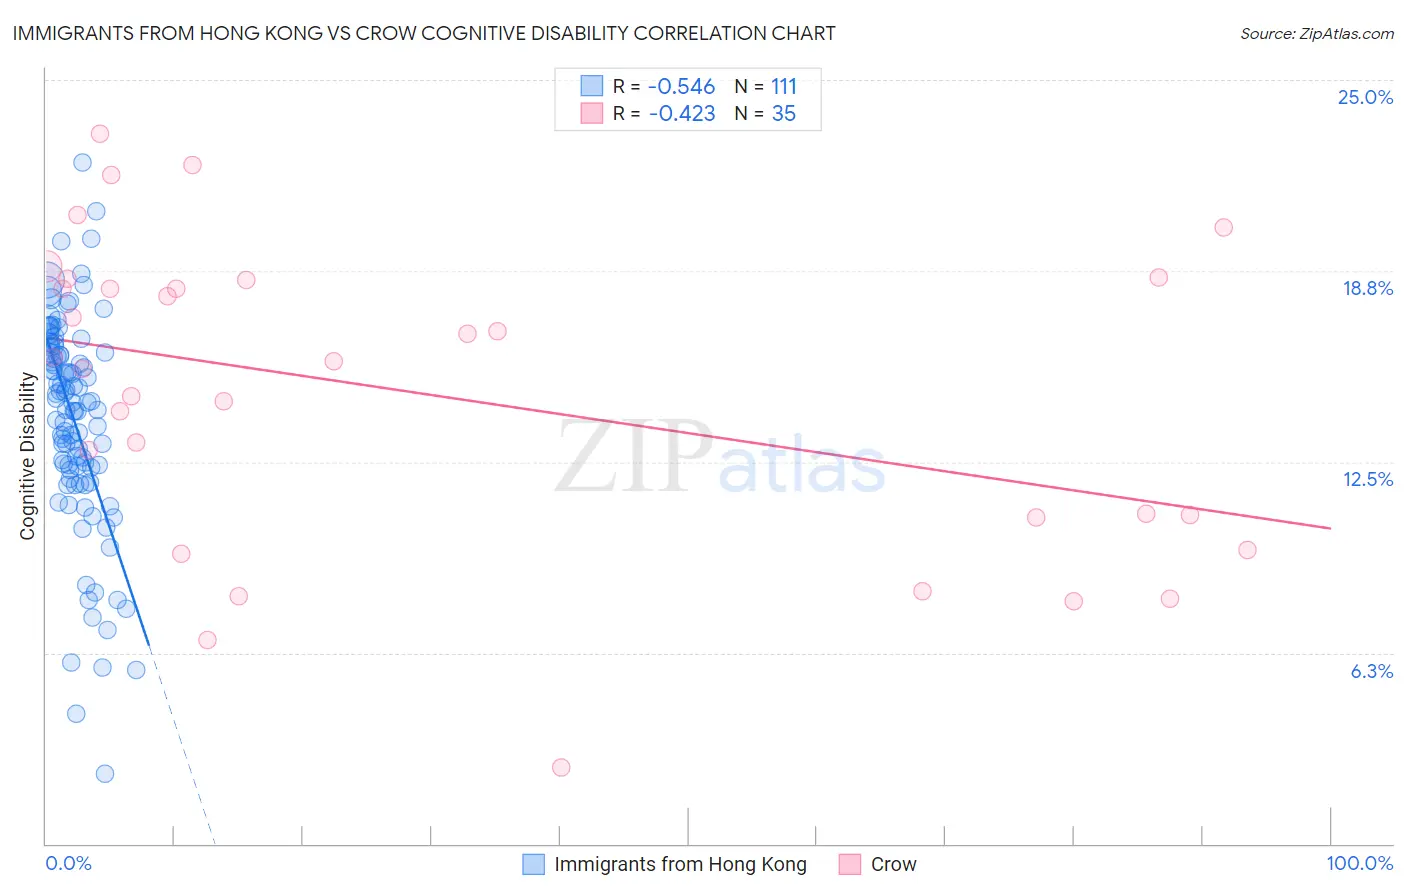
Immigrants from Hong Kong vs Crow Cognitive Disability Correlation Chart
The statistical analysis conducted on geographies consisting of 253,985,578 people shows a substantial negative correlation between the proportion of Immigrants from Hong Kong and percentage of population with cognitive disability in the United States with a correlation coefficient (R) of -0.546 and weighted average of 16.0%. Similarly, the statistical analysis conducted on geographies consisting of 59,204,553 people shows a moderate negative correlation between the proportion of Crow and percentage of population with cognitive disability in the United States with a correlation coefficient (R) of -0.423 and weighted average of 17.3%, a difference of 8.2%.
Cognitive Disability Correlation Summary
| Measurement | Immigrants from Hong Kong | Crow |
| Minimum | 2.3% | 2.5% |
| Maximum | 22.3% | 23.2% |
| Range | 20.0% | 20.7% |
| Mean | 13.8% | 14.7% |
| Median | 14.4% | 15.8% |
| Interquartile 25% (IQ1) | 12.2% | 10.7% |
| Interquartile 75% (IQ3) | 16.1% | 18.5% |
| Interquartile Range (IQR) | 3.9% | 7.8% |
| Standard Deviation (Sample) | 3.5% | 5.0% |
| Standard Deviation (Population) | 3.5% | 5.0% |
Similar Demographics by Cognitive Disability
Demographics Similar to Immigrants from Hong Kong by Cognitive Disability
In terms of cognitive disability, the demographic groups most similar to Immigrants from Hong Kong are Immigrants from Lithuania (16.0%, a difference of 0.41%), Chinese (15.9%, a difference of 0.59%), Thai (16.1%, a difference of 0.61%), Immigrants from India (15.9%, a difference of 0.68%), and Immigrants from Ireland (16.1%, a difference of 0.72%).
| Demographics | Rating | Rank | Cognitive Disability |
| Immigrants | Taiwan | 100.0 /100 | #1 | Exceptional 15.7% |
| Immigrants | India | 100.0 /100 | #2 | Exceptional 15.9% |
| Chinese | 100.0 /100 | #3 | Exceptional 15.9% |
| Immigrants | Lithuania | 100.0 /100 | #4 | Exceptional 16.0% |
| Immigrants | Hong Kong | 100.0 /100 | #5 | Exceptional 16.0% |
| Thais | 100.0 /100 | #6 | Exceptional 16.1% |
| Immigrants | Ireland | 100.0 /100 | #7 | Exceptional 16.1% |
| Immigrants | Poland | 100.0 /100 | #8 | Exceptional 16.1% |
| Assyrians/Chaldeans/Syriacs | 100.0 /100 | #9 | Exceptional 16.2% |
| Immigrants | Scotland | 100.0 /100 | #10 | Exceptional 16.2% |
| Immigrants | Czechoslovakia | 100.0 /100 | #11 | Exceptional 16.2% |
| Maltese | 100.0 /100 | #12 | Exceptional 16.2% |
| Lithuanians | 100.0 /100 | #13 | Exceptional 16.3% |
| Immigrants | Austria | 100.0 /100 | #14 | Exceptional 16.3% |
| Immigrants | Greece | 100.0 /100 | #15 | Exceptional 16.3% |
Demographics Similar to Crow by Cognitive Disability
In terms of cognitive disability, the demographic groups most similar to Crow are Afghan (17.3%, a difference of 0.030%), Spaniard (17.3%, a difference of 0.040%), Cambodian (17.3%, a difference of 0.10%), Immigrants from Guyana (17.3%, a difference of 0.11%), and Arab (17.3%, a difference of 0.11%).
| Demographics | Rating | Rank | Cognitive Disability |
| Ute | 49.1 /100 | #177 | Average 17.3% |
| Spanish | 48.9 /100 | #178 | Average 17.3% |
| Sioux | 48.6 /100 | #179 | Average 17.3% |
| Pakistanis | 43.9 /100 | #180 | Average 17.3% |
| Immigrants | Guyana | 42.9 /100 | #181 | Average 17.3% |
| Arabs | 42.8 /100 | #182 | Average 17.3% |
| Spaniards | 40.3 /100 | #183 | Average 17.3% |
| Crow | 39.1 /100 | #184 | Fair 17.3% |
| Afghans | 38.2 /100 | #185 | Fair 17.3% |
| Cambodians | 35.9 /100 | #186 | Fair 17.3% |
| Immigrants | Fiji | 33.7 /100 | #187 | Fair 17.4% |
| Immigrants | France | 29.8 /100 | #188 | Fair 17.4% |
| Immigrants | Western Asia | 29.5 /100 | #189 | Fair 17.4% |
| Immigrants | Spain | 27.7 /100 | #190 | Fair 17.4% |
| Immigrants | Nonimmigrants | 27.4 /100 | #191 | Fair 17.4% |