Portuguese vs Central American Indian Cognitive Disability
COMPARE
Portuguese
Central American Indian
Cognitive Disability
Cognitive Disability Comparison
Portuguese
Central American Indians
16.9%
COGNITIVE DISABILITY
94.7/ 100
METRIC RATING
123rd/ 347
METRIC RANK
18.2%
COGNITIVE DISABILITY
0.1/ 100
METRIC RATING
293rd/ 347
METRIC RANK
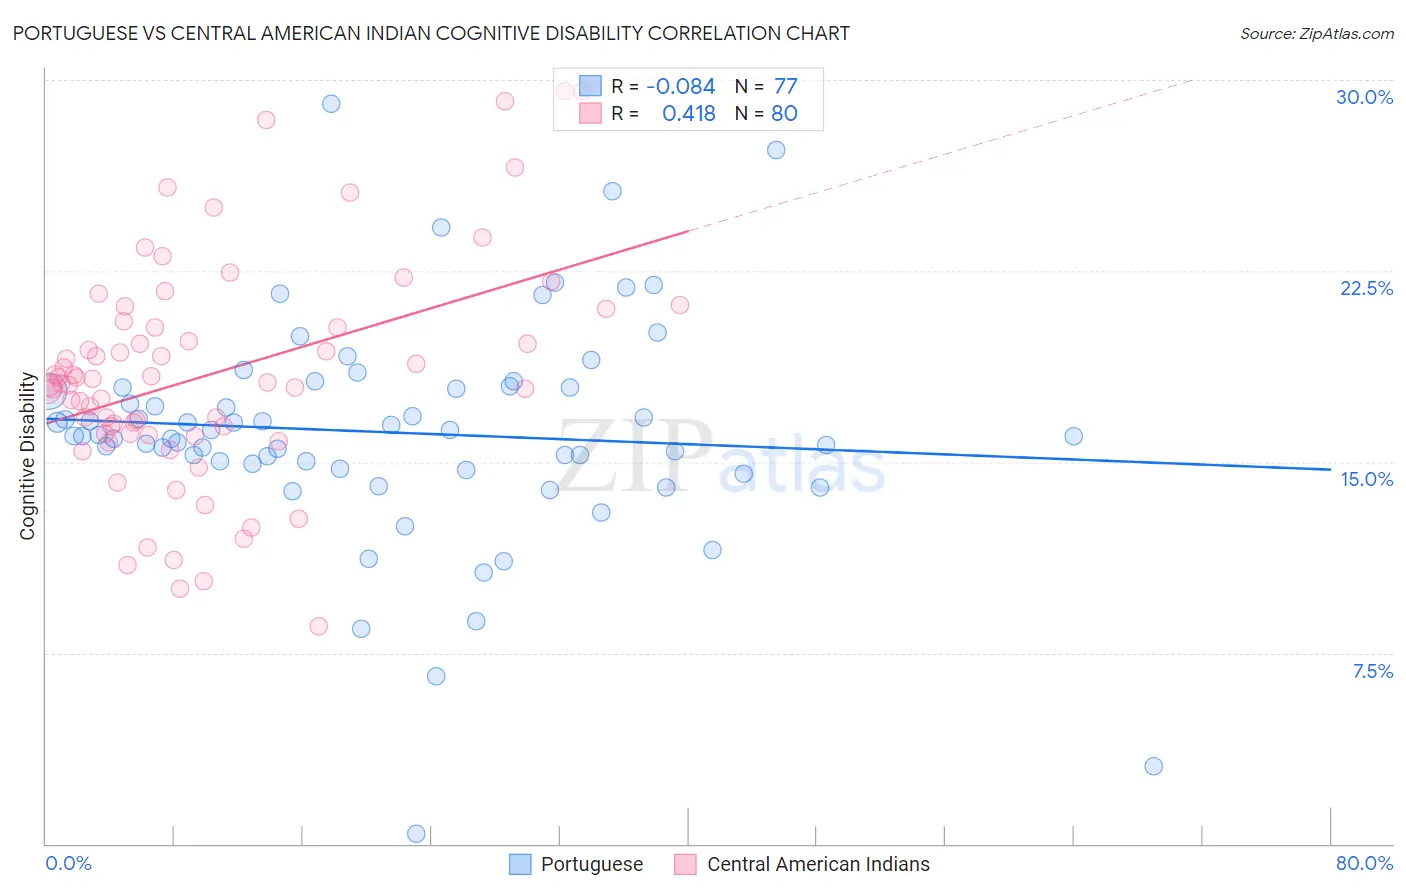
Portuguese vs Central American Indian Cognitive Disability Correlation Chart
The statistical analysis conducted on geographies consisting of 450,269,576 people shows a slight negative correlation between the proportion of Portuguese and percentage of population with cognitive disability in the United States with a correlation coefficient (R) of -0.084 and weighted average of 16.9%. Similarly, the statistical analysis conducted on geographies consisting of 326,115,408 people shows a moderate positive correlation between the proportion of Central American Indians and percentage of population with cognitive disability in the United States with a correlation coefficient (R) of 0.418 and weighted average of 18.2%, a difference of 7.5%.
Cognitive Disability Correlation Summary
| Measurement | Portuguese | Central American Indian |
| Minimum | 0.38% | 8.5% |
| Maximum | 29.1% | 29.6% |
| Range | 28.7% | 21.0% |
| Mean | 16.2% | 18.4% |
| Median | 16.0% | 18.1% |
| Interquartile 25% (IQ1) | 14.8% | 16.1% |
| Interquartile 75% (IQ3) | 17.9% | 20.4% |
| Interquartile Range (IQR) | 3.1% | 4.3% |
| Standard Deviation (Sample) | 4.4% | 4.4% |
| Standard Deviation (Population) | 4.4% | 4.4% |
Similar Demographics by Cognitive Disability
Demographics Similar to Portuguese by Cognitive Disability
In terms of cognitive disability, the demographic groups most similar to Portuguese are Immigrants from Western Europe (16.9%, a difference of 0.010%), Turkish (16.9%, a difference of 0.020%), Immigrants from China (16.9%, a difference of 0.030%), Scottish (16.9%, a difference of 0.040%), and Scandinavian (16.9%, a difference of 0.080%).
| Demographics | Rating | Rank | Cognitive Disability |
| Inupiat | 96.5 /100 | #116 | Exceptional 16.9% |
| Immigrants | Japan | 96.2 /100 | #117 | Exceptional 16.9% |
| Immigrants | Denmark | 96.2 /100 | #118 | Exceptional 16.9% |
| South Africans | 95.5 /100 | #119 | Exceptional 16.9% |
| Scottish | 95.0 /100 | #120 | Exceptional 16.9% |
| Immigrants | China | 94.9 /100 | #121 | Exceptional 16.9% |
| Immigrants | Western Europe | 94.8 /100 | #122 | Exceptional 16.9% |
| Portuguese | 94.7 /100 | #123 | Exceptional 16.9% |
| Turks | 94.5 /100 | #124 | Exceptional 16.9% |
| Scandinavians | 94.1 /100 | #125 | Exceptional 16.9% |
| Europeans | 93.4 /100 | #126 | Exceptional 17.0% |
| Immigrants | Costa Rica | 93.1 /100 | #127 | Exceptional 17.0% |
| Nicaraguans | 93.0 /100 | #128 | Exceptional 17.0% |
| Immigrants | Uruguay | 92.9 /100 | #129 | Exceptional 17.0% |
| Immigrants | Vietnam | 92.4 /100 | #130 | Exceptional 17.0% |
Demographics Similar to Central American Indians by Cognitive Disability
In terms of cognitive disability, the demographic groups most similar to Central American Indians are Iroquois (18.2%, a difference of 0.010%), British West Indian (18.2%, a difference of 0.070%), Ottawa (18.2%, a difference of 0.080%), Immigrants from Africa (18.1%, a difference of 0.21%), and Native/Alaskan (18.1%, a difference of 0.24%).
| Demographics | Rating | Rank | Cognitive Disability |
| Kenyans | 0.1 /100 | #286 | Tragic 18.1% |
| Dutch West Indians | 0.1 /100 | #287 | Tragic 18.1% |
| Immigrants | West Indies | 0.1 /100 | #288 | Tragic 18.1% |
| Natives/Alaskans | 0.1 /100 | #289 | Tragic 18.1% |
| Immigrants | Africa | 0.1 /100 | #290 | Tragic 18.1% |
| Ottawa | 0.1 /100 | #291 | Tragic 18.2% |
| Iroquois | 0.1 /100 | #292 | Tragic 18.2% |
| Central American Indians | 0.1 /100 | #293 | Tragic 18.2% |
| British West Indians | 0.1 /100 | #294 | Tragic 18.2% |
| German Russians | 0.0 /100 | #295 | Tragic 18.2% |
| Immigrants | Burma/Myanmar | 0.0 /100 | #296 | Tragic 18.2% |
| Blackfeet | 0.0 /100 | #297 | Tragic 18.3% |
| Japanese | 0.0 /100 | #298 | Tragic 18.3% |
| Ghanaians | 0.0 /100 | #299 | Tragic 18.3% |
| Creek | 0.0 /100 | #300 | Tragic 18.3% |