Portuguese vs Czechoslovakian Cognitive Disability
COMPARE
Portuguese
Czechoslovakian
Cognitive Disability
Cognitive Disability Comparison
Portuguese
Czechoslovakians
16.9%
COGNITIVE DISABILITY
94.7/ 100
METRIC RATING
123rd/ 347
METRIC RANK
16.6%
COGNITIVE DISABILITY
99.6/ 100
METRIC RATING
62nd/ 347
METRIC RANK
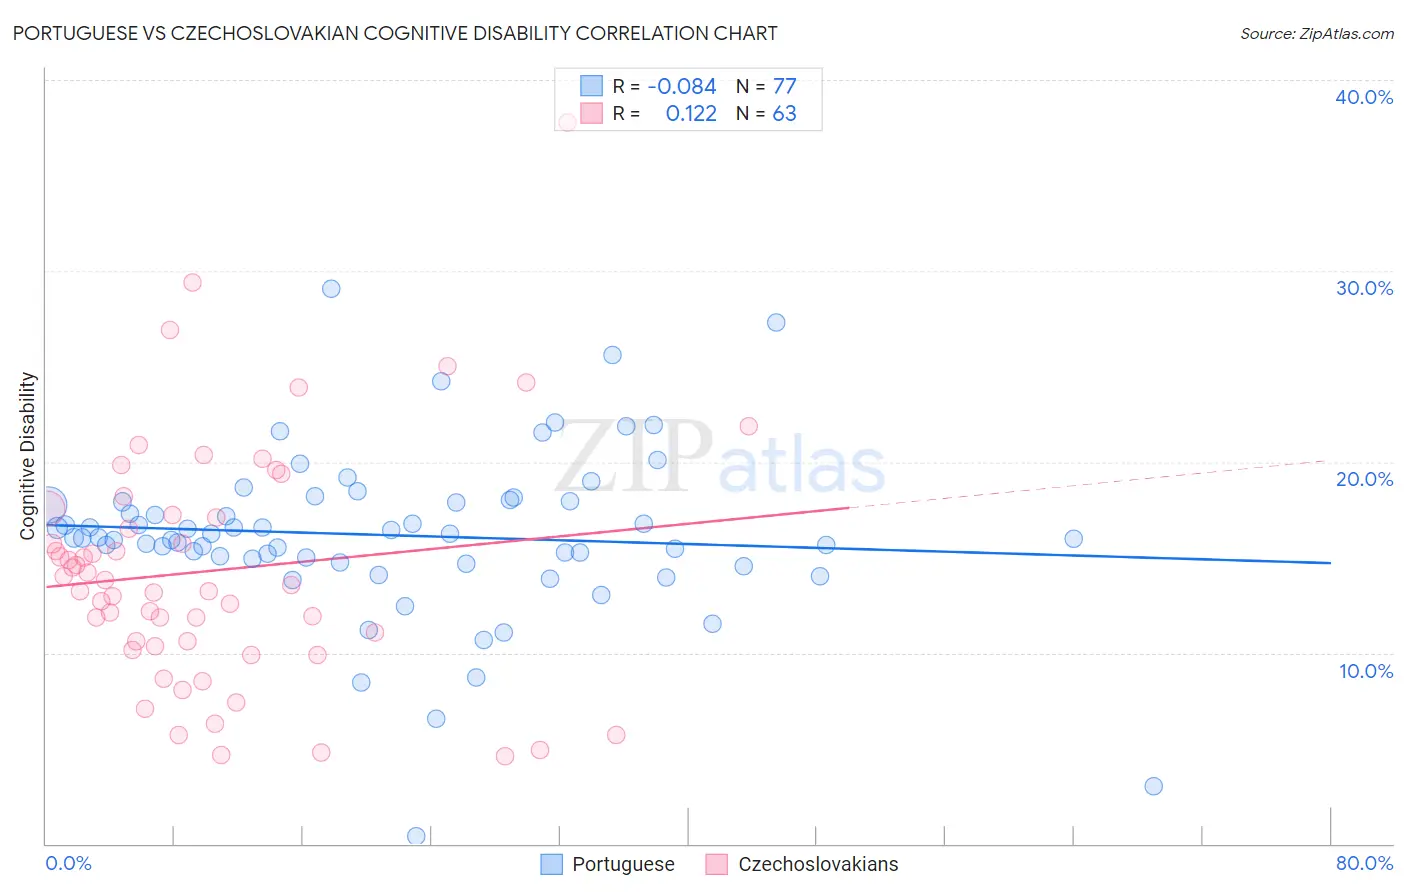
Portuguese vs Czechoslovakian Cognitive Disability Correlation Chart
The statistical analysis conducted on geographies consisting of 450,269,576 people shows a slight negative correlation between the proportion of Portuguese and percentage of population with cognitive disability in the United States with a correlation coefficient (R) of -0.084 and weighted average of 16.9%. Similarly, the statistical analysis conducted on geographies consisting of 368,659,789 people shows a poor positive correlation between the proportion of Czechoslovakians and percentage of population with cognitive disability in the United States with a correlation coefficient (R) of 0.122 and weighted average of 16.6%, a difference of 2.0%.
Cognitive Disability Correlation Summary
| Measurement | Portuguese | Czechoslovakian |
| Minimum | 0.38% | 4.6% |
| Maximum | 29.1% | 37.8% |
| Range | 28.7% | 33.2% |
| Mean | 16.2% | 14.3% |
| Median | 16.0% | 13.6% |
| Interquartile 25% (IQ1) | 14.8% | 10.4% |
| Interquartile 75% (IQ3) | 17.9% | 17.2% |
| Interquartile Range (IQR) | 3.1% | 6.9% |
| Standard Deviation (Sample) | 4.4% | 6.3% |
| Standard Deviation (Population) | 4.4% | 6.3% |
Similar Demographics by Cognitive Disability
Demographics Similar to Portuguese by Cognitive Disability
In terms of cognitive disability, the demographic groups most similar to Portuguese are Immigrants from Western Europe (16.9%, a difference of 0.010%), Turkish (16.9%, a difference of 0.020%), Immigrants from China (16.9%, a difference of 0.030%), Scottish (16.9%, a difference of 0.040%), and Scandinavian (16.9%, a difference of 0.080%).
| Demographics | Rating | Rank | Cognitive Disability |
| Inupiat | 96.5 /100 | #116 | Exceptional 16.9% |
| Immigrants | Japan | 96.2 /100 | #117 | Exceptional 16.9% |
| Immigrants | Denmark | 96.2 /100 | #118 | Exceptional 16.9% |
| South Africans | 95.5 /100 | #119 | Exceptional 16.9% |
| Scottish | 95.0 /100 | #120 | Exceptional 16.9% |
| Immigrants | China | 94.9 /100 | #121 | Exceptional 16.9% |
| Immigrants | Western Europe | 94.8 /100 | #122 | Exceptional 16.9% |
| Portuguese | 94.7 /100 | #123 | Exceptional 16.9% |
| Turks | 94.5 /100 | #124 | Exceptional 16.9% |
| Scandinavians | 94.1 /100 | #125 | Exceptional 16.9% |
| Europeans | 93.4 /100 | #126 | Exceptional 17.0% |
| Immigrants | Costa Rica | 93.1 /100 | #127 | Exceptional 17.0% |
| Nicaraguans | 93.0 /100 | #128 | Exceptional 17.0% |
| Immigrants | Uruguay | 92.9 /100 | #129 | Exceptional 17.0% |
| Immigrants | Vietnam | 92.4 /100 | #130 | Exceptional 17.0% |
Demographics Similar to Czechoslovakians by Cognitive Disability
In terms of cognitive disability, the demographic groups most similar to Czechoslovakians are Argentinean (16.6%, a difference of 0.020%), Immigrants from England (16.6%, a difference of 0.030%), Venezuelan (16.6%, a difference of 0.080%), Romanian (16.6%, a difference of 0.090%), and Pennsylvania German (16.6%, a difference of 0.10%).
| Demographics | Rating | Rank | Cognitive Disability |
| Immigrants | Venezuela | 99.7 /100 | #55 | Exceptional 16.5% |
| Austrians | 99.7 /100 | #56 | Exceptional 16.6% |
| Bhutanese | 99.7 /100 | #57 | Exceptional 16.6% |
| Pennsylvania Germans | 99.7 /100 | #58 | Exceptional 16.6% |
| Immigrants | Peru | 99.7 /100 | #59 | Exceptional 16.6% |
| Romanians | 99.7 /100 | #60 | Exceptional 16.6% |
| Immigrants | England | 99.6 /100 | #61 | Exceptional 16.6% |
| Czechoslovakians | 99.6 /100 | #62 | Exceptional 16.6% |
| Argentineans | 99.6 /100 | #63 | Exceptional 16.6% |
| Venezuelans | 99.6 /100 | #64 | Exceptional 16.6% |
| Colombians | 99.6 /100 | #65 | Exceptional 16.6% |
| Immigrants | Ukraine | 99.5 /100 | #66 | Exceptional 16.6% |
| Latvians | 99.5 /100 | #67 | Exceptional 16.6% |
| Ukrainians | 99.4 /100 | #68 | Exceptional 16.6% |
| Immigrants | Uzbekistan | 99.4 /100 | #69 | Exceptional 16.7% |