Seminole vs Korean Disability
COMPARE
Seminole
Korean
Disability
Disability Comparison
Seminole
Koreans
14.9%
DISABILITY
0.0/ 100
METRIC RATING
337th/ 347
METRIC RANK
11.3%
DISABILITY
93.8/ 100
METRIC RATING
118th/ 347
METRIC RANK
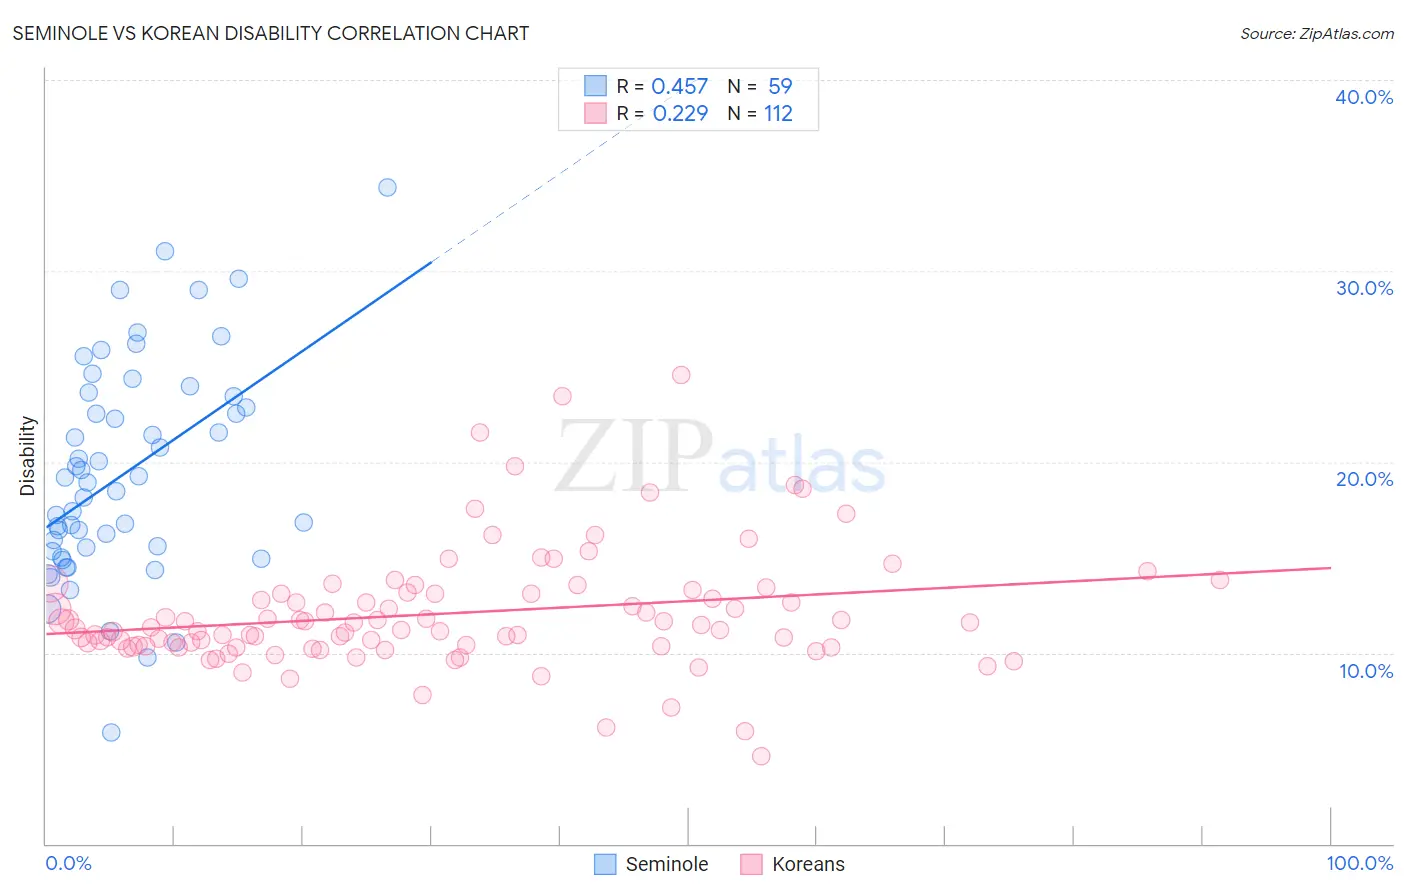
Seminole vs Korean Disability Correlation Chart
The statistical analysis conducted on geographies consisting of 118,308,491 people shows a moderate positive correlation between the proportion of Seminole and percentage of population with a disability in the United States with a correlation coefficient (R) of 0.457 and weighted average of 14.9%. Similarly, the statistical analysis conducted on geographies consisting of 510,851,171 people shows a weak positive correlation between the proportion of Koreans and percentage of population with a disability in the United States with a correlation coefficient (R) of 0.229 and weighted average of 11.3%, a difference of 30.9%.
Disability Correlation Summary
| Measurement | Seminole | Korean |
| Minimum | 5.8% | 4.6% |
| Maximum | 34.4% | 24.5% |
| Range | 28.5% | 20.0% |
| Mean | 19.4% | 12.1% |
| Median | 18.9% | 11.3% |
| Interquartile 25% (IQ1) | 15.3% | 10.3% |
| Interquartile 75% (IQ3) | 23.4% | 13.1% |
| Interquartile Range (IQR) | 8.1% | 2.8% |
| Standard Deviation (Sample) | 5.7% | 3.1% |
| Standard Deviation (Population) | 5.6% | 3.1% |
Similar Demographics by Disability
Demographics Similar to Seminole by Disability
In terms of disability, the demographic groups most similar to Seminole are Cherokee (14.8%, a difference of 0.090%), Dutch West Indian (14.9%, a difference of 0.30%), Tohono O'odham (14.8%, a difference of 0.61%), Yuman (14.6%, a difference of 1.7%), and Cajun (14.6%, a difference of 1.8%).
| Demographics | Rating | Rank | Disability |
| Navajo | 0.0 /100 | #330 | Tragic 14.3% |
| Alaskan Athabascans | 0.0 /100 | #331 | Tragic 14.4% |
| Pueblo | 0.0 /100 | #332 | Tragic 14.4% |
| Cajuns | 0.0 /100 | #333 | Tragic 14.6% |
| Yuman | 0.0 /100 | #334 | Tragic 14.6% |
| Tohono O'odham | 0.0 /100 | #335 | Tragic 14.8% |
| Cherokee | 0.0 /100 | #336 | Tragic 14.8% |
| Seminole | 0.0 /100 | #337 | Tragic 14.9% |
| Dutch West Indians | 0.0 /100 | #338 | Tragic 14.9% |
| Chickasaw | 0.0 /100 | #339 | Tragic 15.2% |
| Choctaw | 0.0 /100 | #340 | Tragic 15.4% |
| Lumbee | 0.0 /100 | #341 | Tragic 15.5% |
| Kiowa | 0.0 /100 | #342 | Tragic 15.6% |
| Creek | 0.0 /100 | #343 | Tragic 15.6% |
| Colville | 0.0 /100 | #344 | Tragic 15.8% |
Demographics Similar to Koreans by Disability
In terms of disability, the demographic groups most similar to Koreans are Luxembourger (11.3%, a difference of 0.010%), Central American (11.4%, a difference of 0.050%), Immigrants from North Macedonia (11.4%, a difference of 0.060%), Immigrants from Northern Europe (11.3%, a difference of 0.070%), and Immigrants from Costa Rica (11.4%, a difference of 0.070%).
| Demographics | Rating | Rank | Disability |
| Immigrants | South Eastern Asia | 95.4 /100 | #111 | Exceptional 11.3% |
| Immigrants | Uzbekistan | 94.9 /100 | #112 | Exceptional 11.3% |
| Guyanese | 94.7 /100 | #113 | Exceptional 11.3% |
| Immigrants | Syria | 94.7 /100 | #114 | Exceptional 11.3% |
| Immigrants | Philippines | 94.6 /100 | #115 | Exceptional 11.3% |
| Immigrants | Northern Europe | 94.1 /100 | #116 | Exceptional 11.3% |
| Luxembourgers | 93.9 /100 | #117 | Exceptional 11.3% |
| Koreans | 93.8 /100 | #118 | Exceptional 11.3% |
| Central Americans | 93.5 /100 | #119 | Exceptional 11.4% |
| Immigrants | North Macedonia | 93.5 /100 | #120 | Exceptional 11.4% |
| Immigrants | Costa Rica | 93.4 /100 | #121 | Exceptional 11.4% |
| Brazilians | 93.3 /100 | #122 | Exceptional 11.4% |
| South Africans | 92.3 /100 | #123 | Exceptional 11.4% |
| South American Indians | 92.2 /100 | #124 | Exceptional 11.4% |
| Costa Ricans | 91.9 /100 | #125 | Exceptional 11.4% |