Immigrants from Thailand vs Arab Disability
COMPARE
Immigrants from Thailand
Arab
Disability
Disability Comparison
Immigrants from Thailand
Arabs
12.0%
DISABILITY
9.3/ 100
METRIC RATING
207th/ 347
METRIC RANK
11.4%
DISABILITY
89.1/ 100
METRIC RATING
133rd/ 347
METRIC RANK
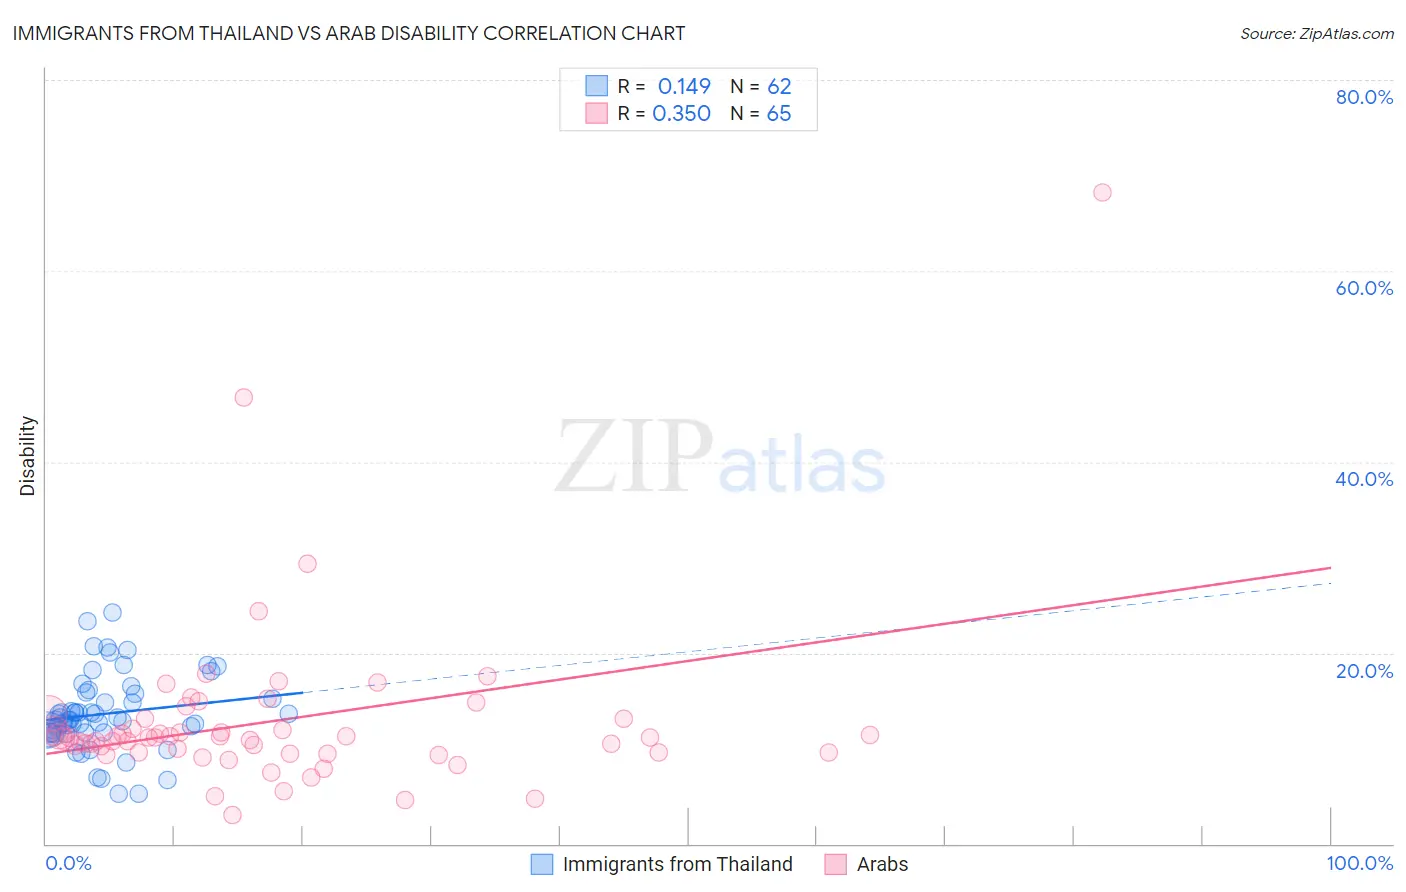
Immigrants from Thailand vs Arab Disability Correlation Chart
The statistical analysis conducted on geographies consisting of 316,986,616 people shows a poor positive correlation between the proportion of Immigrants from Thailand and percentage of population with a disability in the United States with a correlation coefficient (R) of 0.149 and weighted average of 12.0%. Similarly, the statistical analysis conducted on geographies consisting of 486,795,543 people shows a mild positive correlation between the proportion of Arabs and percentage of population with a disability in the United States with a correlation coefficient (R) of 0.350 and weighted average of 11.4%, a difference of 5.0%.
Disability Correlation Summary
| Measurement | Immigrants from Thailand | Arab |
| Minimum | 5.2% | 3.0% |
| Maximum | 24.2% | 68.2% |
| Range | 19.0% | 65.2% |
| Mean | 13.6% | 12.9% |
| Median | 13.0% | 11.1% |
| Interquartile 25% (IQ1) | 11.7% | 9.6% |
| Interquartile 75% (IQ3) | 15.6% | 13.1% |
| Interquartile Range (IQR) | 4.0% | 3.5% |
| Standard Deviation (Sample) | 4.0% | 9.2% |
| Standard Deviation (Population) | 3.9% | 9.1% |
Similar Demographics by Disability
Demographics Similar to Immigrants from Thailand by Disability
In terms of disability, the demographic groups most similar to Immigrants from Thailand are Immigrants from Senegal (12.0%, a difference of 0.010%), Immigrants from Caribbean (12.0%, a difference of 0.020%), Danish (12.0%, a difference of 0.070%), Immigrants from Western Europe (12.0%, a difference of 0.10%), and Czech (12.0%, a difference of 0.19%).
| Demographics | Rating | Rank | Disability |
| Belizeans | 12.8 /100 | #200 | Poor 11.9% |
| Assyrians/Chaldeans/Syriacs | 12.6 /100 | #201 | Poor 11.9% |
| Immigrants | England | 12.0 /100 | #202 | Poor 12.0% |
| British West Indians | 11.5 /100 | #203 | Poor 12.0% |
| Mexican American Indians | 11.4 /100 | #204 | Poor 12.0% |
| Immigrants | Western Europe | 10.1 /100 | #205 | Poor 12.0% |
| Immigrants | Senegal | 9.4 /100 | #206 | Tragic 12.0% |
| Immigrants | Thailand | 9.3 /100 | #207 | Tragic 12.0% |
| Immigrants | Caribbean | 9.1 /100 | #208 | Tragic 12.0% |
| Danes | 8.7 /100 | #209 | Tragic 12.0% |
| Czechs | 7.9 /100 | #210 | Tragic 12.0% |
| Immigrants | Cambodia | 7.3 /100 | #211 | Tragic 12.0% |
| Austrians | 7.2 /100 | #212 | Tragic 12.0% |
| Immigrants | Iraq | 7.1 /100 | #213 | Tragic 12.0% |
| Immigrants | Somalia | 6.8 /100 | #214 | Tragic 12.0% |
Demographics Similar to Arabs by Disability
In terms of disability, the demographic groups most similar to Arabs are Immigrants from Africa (11.4%, a difference of 0.030%), Immigrants from Croatia (11.4%, a difference of 0.080%), Immigrants from Guyana (11.4%, a difference of 0.080%), Latvian (11.4%, a difference of 0.090%), and Ugandan (11.4%, a difference of 0.13%).
| Demographics | Rating | Rank | Disability |
| Immigrants | Latvia | 90.9 /100 | #126 | Exceptional 11.4% |
| Immigrants | Italy | 90.4 /100 | #127 | Exceptional 11.4% |
| Immigrants | Europe | 90.4 /100 | #128 | Exceptional 11.4% |
| Macedonians | 90.3 /100 | #129 | Exceptional 11.4% |
| Latvians | 89.8 /100 | #130 | Excellent 11.4% |
| Immigrants | Croatia | 89.8 /100 | #131 | Excellent 11.4% |
| Immigrants | Africa | 89.3 /100 | #132 | Excellent 11.4% |
| Arabs | 89.1 /100 | #133 | Excellent 11.4% |
| Immigrants | Guyana | 88.3 /100 | #134 | Excellent 11.4% |
| Ugandans | 87.9 /100 | #135 | Excellent 11.4% |
| Immigrants | St. Vincent and the Grenadines | 87.8 /100 | #136 | Excellent 11.4% |
| Kenyans | 87.1 /100 | #137 | Excellent 11.5% |
| New Zealanders | 87.0 /100 | #138 | Excellent 11.5% |
| Ghanaians | 87.0 /100 | #139 | Excellent 11.5% |
| Russians | 86.8 /100 | #140 | Excellent 11.5% |