Polish vs Immigrants from Yemen Cognitive Disability
COMPARE
Polish
Immigrants from Yemen
Cognitive Disability
Cognitive Disability Comparison
Poles
Immigrants from Yemen
16.4%
COGNITIVE DISABILITY
99.9/ 100
METRIC RATING
28th/ 347
METRIC RANK
18.8%
COGNITIVE DISABILITY
0.0/ 100
METRIC RATING
333rd/ 347
METRIC RANK
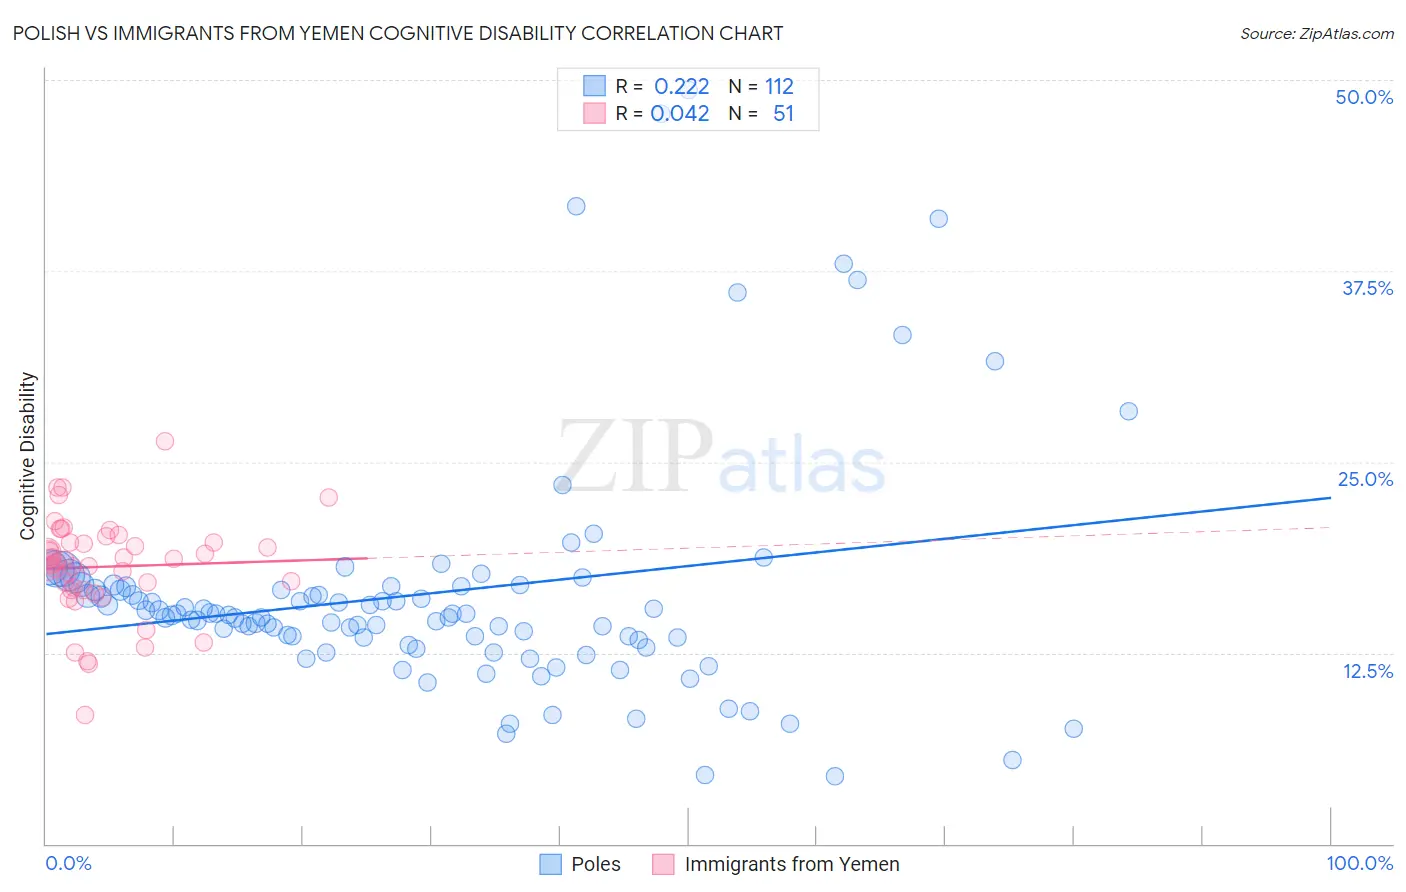
Polish vs Immigrants from Yemen Cognitive Disability Correlation Chart
The statistical analysis conducted on geographies consisting of 560,438,383 people shows a weak positive correlation between the proportion of Poles and percentage of population with cognitive disability in the United States with a correlation coefficient (R) of 0.222 and weighted average of 16.4%. Similarly, the statistical analysis conducted on geographies consisting of 82,433,611 people shows no correlation between the proportion of Immigrants from Yemen and percentage of population with cognitive disability in the United States with a correlation coefficient (R) of 0.042 and weighted average of 18.8%, a difference of 14.8%.
Cognitive Disability Correlation Summary
| Measurement | Polish | Immigrants from Yemen |
| Minimum | 4.4% | 8.4% |
| Maximum | 49.3% | 26.3% |
| Range | 44.9% | 17.9% |
| Mean | 16.4% | 18.1% |
| Median | 15.0% | 18.4% |
| Interquartile 25% (IQ1) | 13.4% | 16.6% |
| Interquartile 75% (IQ3) | 16.8% | 19.7% |
| Interquartile Range (IQR) | 3.4% | 3.1% |
| Standard Deviation (Sample) | 7.8% | 3.2% |
| Standard Deviation (Population) | 7.8% | 3.2% |
Similar Demographics by Cognitive Disability
Demographics Similar to Poles by Cognitive Disability
In terms of cognitive disability, the demographic groups most similar to Poles are Immigrants from Pakistan (16.4%, a difference of 0.0%), Immigrants from Croatia (16.4%, a difference of 0.020%), Filipino (16.4%, a difference of 0.030%), Czech (16.4%, a difference of 0.030%), and Luxembourger (16.4%, a difference of 0.050%).
| Demographics | Rating | Rank | Cognitive Disability |
| Immigrants | Cuba | 100.0 /100 | #21 | Exceptional 16.3% |
| Immigrants | South Central Asia | 99.9 /100 | #22 | Exceptional 16.4% |
| Croatians | 99.9 /100 | #23 | Exceptional 16.4% |
| Immigrants | Argentina | 99.9 /100 | #24 | Exceptional 16.4% |
| Luxembourgers | 99.9 /100 | #25 | Exceptional 16.4% |
| Immigrants | Croatia | 99.9 /100 | #26 | Exceptional 16.4% |
| Immigrants | Pakistan | 99.9 /100 | #27 | Exceptional 16.4% |
| Poles | 99.9 /100 | #28 | Exceptional 16.4% |
| Filipinos | 99.9 /100 | #29 | Exceptional 16.4% |
| Czechs | 99.9 /100 | #30 | Exceptional 16.4% |
| Immigrants | Romania | 99.9 /100 | #31 | Exceptional 16.4% |
| Immigrants | Israel | 99.9 /100 | #32 | Exceptional 16.4% |
| Italians | 99.9 /100 | #33 | Exceptional 16.4% |
| Russians | 99.9 /100 | #34 | Exceptional 16.4% |
| Slovaks | 99.9 /100 | #35 | Exceptional 16.4% |
Demographics Similar to Immigrants from Yemen by Cognitive Disability
In terms of cognitive disability, the demographic groups most similar to Immigrants from Yemen are Immigrants from Sudan (18.8%, a difference of 0.060%), Pima (18.8%, a difference of 0.070%), Immigrants from Dominican Republic (18.8%, a difference of 0.14%), Navajo (18.8%, a difference of 0.24%), and Sudanese (18.9%, a difference of 0.38%).
| Demographics | Rating | Rank | Cognitive Disability |
| Immigrants | Senegal | 0.0 /100 | #326 | Tragic 18.7% |
| U.S. Virgin Islanders | 0.0 /100 | #327 | Tragic 18.7% |
| Kiowa | 0.0 /100 | #328 | Tragic 18.7% |
| Navajo | 0.0 /100 | #329 | Tragic 18.8% |
| Immigrants | Dominican Republic | 0.0 /100 | #330 | Tragic 18.8% |
| Pima | 0.0 /100 | #331 | Tragic 18.8% |
| Immigrants | Sudan | 0.0 /100 | #332 | Tragic 18.8% |
| Immigrants | Yemen | 0.0 /100 | #333 | Tragic 18.8% |
| Sudanese | 0.0 /100 | #334 | Tragic 18.9% |
| Senegalese | 0.0 /100 | #335 | Tragic 19.0% |
| Blacks/African Americans | 0.0 /100 | #336 | Tragic 19.0% |
| Immigrants | Saudi Arabia | 0.0 /100 | #337 | Tragic 19.1% |
| Lumbee | 0.0 /100 | #338 | Tragic 19.1% |
| Puerto Ricans | 0.0 /100 | #339 | Tragic 19.2% |
| Cape Verdeans | 0.0 /100 | #340 | Tragic 19.2% |