Polish vs Immigrants from Thailand Cognitive Disability
COMPARE
Polish
Immigrants from Thailand
Cognitive Disability
Cognitive Disability Comparison
Poles
Immigrants from Thailand
16.4%
COGNITIVE DISABILITY
99.9/ 100
METRIC RATING
28th/ 347
METRIC RANK
17.9%
COGNITIVE DISABILITY
0.8/ 100
METRIC RATING
246th/ 347
METRIC RANK
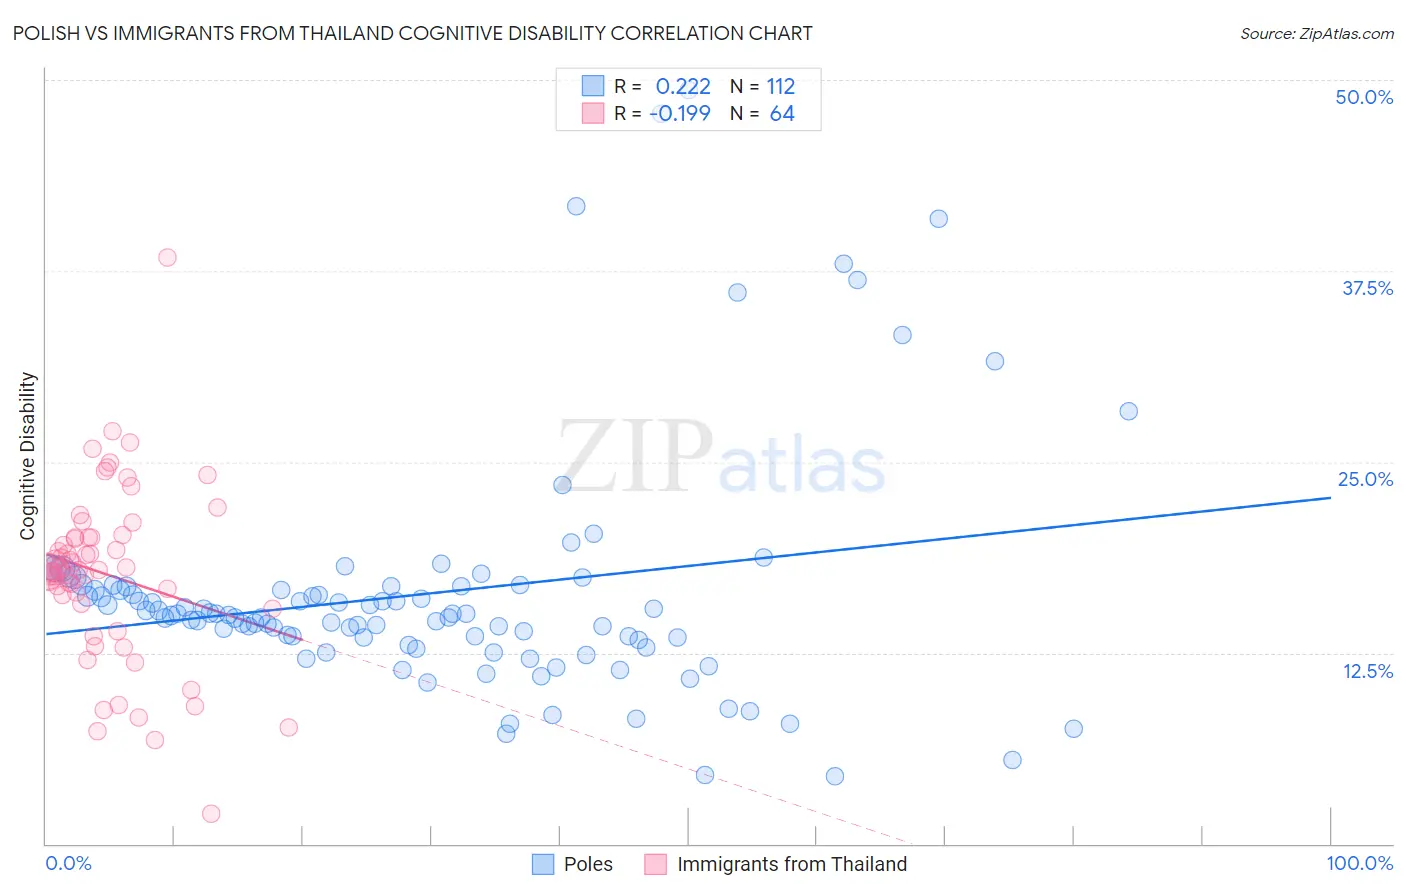
Polish vs Immigrants from Thailand Cognitive Disability Correlation Chart
The statistical analysis conducted on geographies consisting of 560,438,383 people shows a weak positive correlation between the proportion of Poles and percentage of population with cognitive disability in the United States with a correlation coefficient (R) of 0.222 and weighted average of 16.4%. Similarly, the statistical analysis conducted on geographies consisting of 316,987,546 people shows a poor negative correlation between the proportion of Immigrants from Thailand and percentage of population with cognitive disability in the United States with a correlation coefficient (R) of -0.199 and weighted average of 17.9%, a difference of 9.1%.
Cognitive Disability Correlation Summary
| Measurement | Polish | Immigrants from Thailand |
| Minimum | 4.4% | 2.0% |
| Maximum | 49.3% | 38.4% |
| Range | 44.9% | 36.4% |
| Mean | 16.4% | 17.6% |
| Median | 15.0% | 17.9% |
| Interquartile 25% (IQ1) | 13.4% | 15.5% |
| Interquartile 75% (IQ3) | 16.8% | 20.1% |
| Interquartile Range (IQR) | 3.4% | 4.5% |
| Standard Deviation (Sample) | 7.8% | 5.8% |
| Standard Deviation (Population) | 7.8% | 5.8% |
Similar Demographics by Cognitive Disability
Demographics Similar to Poles by Cognitive Disability
In terms of cognitive disability, the demographic groups most similar to Poles are Immigrants from Pakistan (16.4%, a difference of 0.0%), Immigrants from Croatia (16.4%, a difference of 0.020%), Filipino (16.4%, a difference of 0.030%), Czech (16.4%, a difference of 0.030%), and Luxembourger (16.4%, a difference of 0.050%).
| Demographics | Rating | Rank | Cognitive Disability |
| Immigrants | Cuba | 100.0 /100 | #21 | Exceptional 16.3% |
| Immigrants | South Central Asia | 99.9 /100 | #22 | Exceptional 16.4% |
| Croatians | 99.9 /100 | #23 | Exceptional 16.4% |
| Immigrants | Argentina | 99.9 /100 | #24 | Exceptional 16.4% |
| Luxembourgers | 99.9 /100 | #25 | Exceptional 16.4% |
| Immigrants | Croatia | 99.9 /100 | #26 | Exceptional 16.4% |
| Immigrants | Pakistan | 99.9 /100 | #27 | Exceptional 16.4% |
| Poles | 99.9 /100 | #28 | Exceptional 16.4% |
| Filipinos | 99.9 /100 | #29 | Exceptional 16.4% |
| Czechs | 99.9 /100 | #30 | Exceptional 16.4% |
| Immigrants | Romania | 99.9 /100 | #31 | Exceptional 16.4% |
| Immigrants | Israel | 99.9 /100 | #32 | Exceptional 16.4% |
| Italians | 99.9 /100 | #33 | Exceptional 16.4% |
| Russians | 99.9 /100 | #34 | Exceptional 16.4% |
| Slovaks | 99.9 /100 | #35 | Exceptional 16.4% |
Demographics Similar to Immigrants from Thailand by Cognitive Disability
In terms of cognitive disability, the demographic groups most similar to Immigrants from Thailand are Trinidadian and Tobagonian (17.9%, a difference of 0.020%), Samoan (17.9%, a difference of 0.070%), French American Indian (17.9%, a difference of 0.080%), Jamaican (17.9%, a difference of 0.12%), and Cree (17.9%, a difference of 0.13%).
| Demographics | Rating | Rank | Cognitive Disability |
| Cajuns | 1.4 /100 | #239 | Tragic 17.8% |
| Iraqis | 1.4 /100 | #240 | Tragic 17.8% |
| Mexicans | 1.1 /100 | #241 | Tragic 17.8% |
| Paiute | 1.1 /100 | #242 | Tragic 17.8% |
| Immigrants | Bangladesh | 1.0 /100 | #243 | Tragic 17.8% |
| Jamaicans | 0.9 /100 | #244 | Tragic 17.9% |
| Trinidadians and Tobagonians | 0.8 /100 | #245 | Tragic 17.9% |
| Immigrants | Thailand | 0.8 /100 | #246 | Tragic 17.9% |
| Samoans | 0.7 /100 | #247 | Tragic 17.9% |
| French American Indians | 0.7 /100 | #248 | Tragic 17.9% |
| Cree | 0.7 /100 | #249 | Tragic 17.9% |
| Immigrants | Ethiopia | 0.7 /100 | #250 | Tragic 17.9% |
| Malaysians | 0.6 /100 | #251 | Tragic 17.9% |
| Immigrants | Grenada | 0.6 /100 | #252 | Tragic 17.9% |
| Hopi | 0.6 /100 | #253 | Tragic 17.9% |