Immigrants from Africa vs Immigrants from Pakistan Vision Disability
COMPARE
Immigrants from Africa
Immigrants from Pakistan
Vision Disability
Vision Disability Comparison
Immigrants from Africa
Immigrants from Pakistan
2.1%
VISION DISABILITY
62.6/ 100
METRIC RATING
167th/ 347
METRIC RANK
1.9%
VISION DISABILITY
100.0/ 100
METRIC RATING
22nd/ 347
METRIC RANK
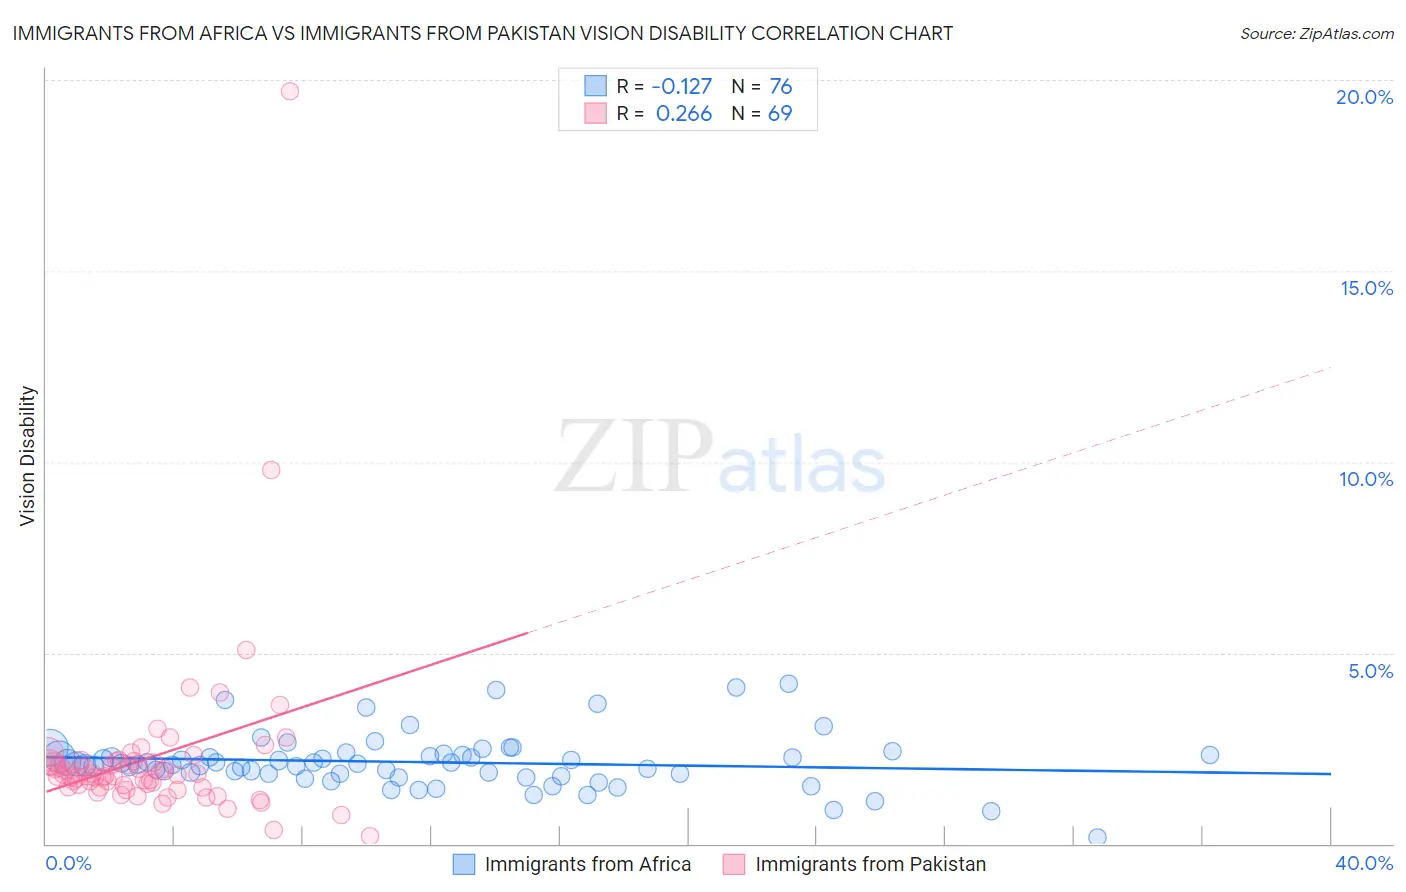
Immigrants from Africa vs Immigrants from Pakistan Vision Disability Correlation Chart
The statistical analysis conducted on geographies consisting of 468,780,270 people shows a poor negative correlation between the proportion of Immigrants from Africa and percentage of population with vision disability in the United States with a correlation coefficient (R) of -0.127 and weighted average of 2.1%. Similarly, the statistical analysis conducted on geographies consisting of 283,768,855 people shows a weak positive correlation between the proportion of Immigrants from Pakistan and percentage of population with vision disability in the United States with a correlation coefficient (R) of 0.266 and weighted average of 1.9%, a difference of 12.7%.
Vision Disability Correlation Summary
| Measurement | Immigrants from Africa | Immigrants from Pakistan |
| Minimum | 0.17% | 0.21% |
| Maximum | 4.2% | 19.7% |
| Range | 4.0% | 19.5% |
| Mean | 2.1% | 2.3% |
| Median | 2.1% | 1.8% |
| Interquartile 25% (IQ1) | 1.8% | 1.5% |
| Interquartile 75% (IQ3) | 2.3% | 2.2% |
| Interquartile Range (IQR) | 0.50% | 0.69% |
| Standard Deviation (Sample) | 0.70% | 2.5% |
| Standard Deviation (Population) | 0.70% | 2.4% |
Similar Demographics by Vision Disability
Demographics Similar to Immigrants from Africa by Vision Disability
In terms of vision disability, the demographic groups most similar to Immigrants from Africa are Immigrants from England (2.1%, a difference of 0.010%), Brazilian (2.1%, a difference of 0.030%), Immigrants from Iraq (2.1%, a difference of 0.15%), Immigrants from Bangladesh (2.1%, a difference of 0.20%), and Icelander (2.1%, a difference of 0.24%).
| Demographics | Rating | Rank | Vision Disability |
| Austrians | 69.0 /100 | #160 | Good 2.1% |
| Iraqis | 67.7 /100 | #161 | Good 2.1% |
| Hungarians | 67.4 /100 | #162 | Good 2.1% |
| Icelanders | 66.1 /100 | #163 | Good 2.1% |
| Immigrants | Bangladesh | 65.5 /100 | #164 | Good 2.1% |
| Immigrants | Iraq | 64.8 /100 | #165 | Good 2.1% |
| Immigrants | England | 62.8 /100 | #166 | Good 2.1% |
| Immigrants | Africa | 62.6 /100 | #167 | Good 2.1% |
| Brazilians | 62.2 /100 | #168 | Good 2.1% |
| South American Indians | 57.4 /100 | #169 | Average 2.2% |
| Swiss | 55.7 /100 | #170 | Average 2.2% |
| Lebanese | 54.3 /100 | #171 | Average 2.2% |
| Northern Europeans | 50.1 /100 | #172 | Average 2.2% |
| Scandinavians | 50.0 /100 | #173 | Average 2.2% |
| Immigrants | Canada | 50.0 /100 | #174 | Average 2.2% |
Demographics Similar to Immigrants from Pakistan by Vision Disability
In terms of vision disability, the demographic groups most similar to Immigrants from Pakistan are Turkish (1.9%, a difference of 0.050%), Asian (1.9%, a difference of 0.35%), Immigrants from Asia (1.9%, a difference of 0.54%), Immigrants from Lithuania (1.9%, a difference of 0.66%), and Bulgarian (1.9%, a difference of 0.70%).
| Demographics | Rating | Rank | Vision Disability |
| Immigrants | Bolivia | 100.0 /100 | #15 | Exceptional 1.8% |
| Indians (Asian) | 100.0 /100 | #16 | Exceptional 1.8% |
| Burmese | 100.0 /100 | #17 | Exceptional 1.8% |
| Bolivians | 100.0 /100 | #18 | Exceptional 1.9% |
| Immigrants | Sri Lanka | 100.0 /100 | #19 | Exceptional 1.9% |
| Asians | 100.0 /100 | #20 | Exceptional 1.9% |
| Turks | 100.0 /100 | #21 | Exceptional 1.9% |
| Immigrants | Pakistan | 100.0 /100 | #22 | Exceptional 1.9% |
| Immigrants | Asia | 99.9 /100 | #23 | Exceptional 1.9% |
| Immigrants | Lithuania | 99.9 /100 | #24 | Exceptional 1.9% |
| Bulgarians | 99.9 /100 | #25 | Exceptional 1.9% |
| Immigrants | Japan | 99.9 /100 | #26 | Exceptional 1.9% |
| Taiwanese | 99.9 /100 | #27 | Exceptional 1.9% |
| Immigrants | Malaysia | 99.9 /100 | #28 | Exceptional 1.9% |
| Egyptians | 99.9 /100 | #29 | Exceptional 1.9% |