Pima vs Cree Disability Age Over 75
COMPARE
Pima
Cree
Disability Age Over 75
Disability Age Over 75 Comparison
Pima
Cree
55.8%
DISABILITY AGE OVER 75
0.0/ 100
METRIC RATING
339th/ 347
METRIC RANK
48.2%
DISABILITY AGE OVER 75
4.2/ 100
METRIC RATING
233rd/ 347
METRIC RANK
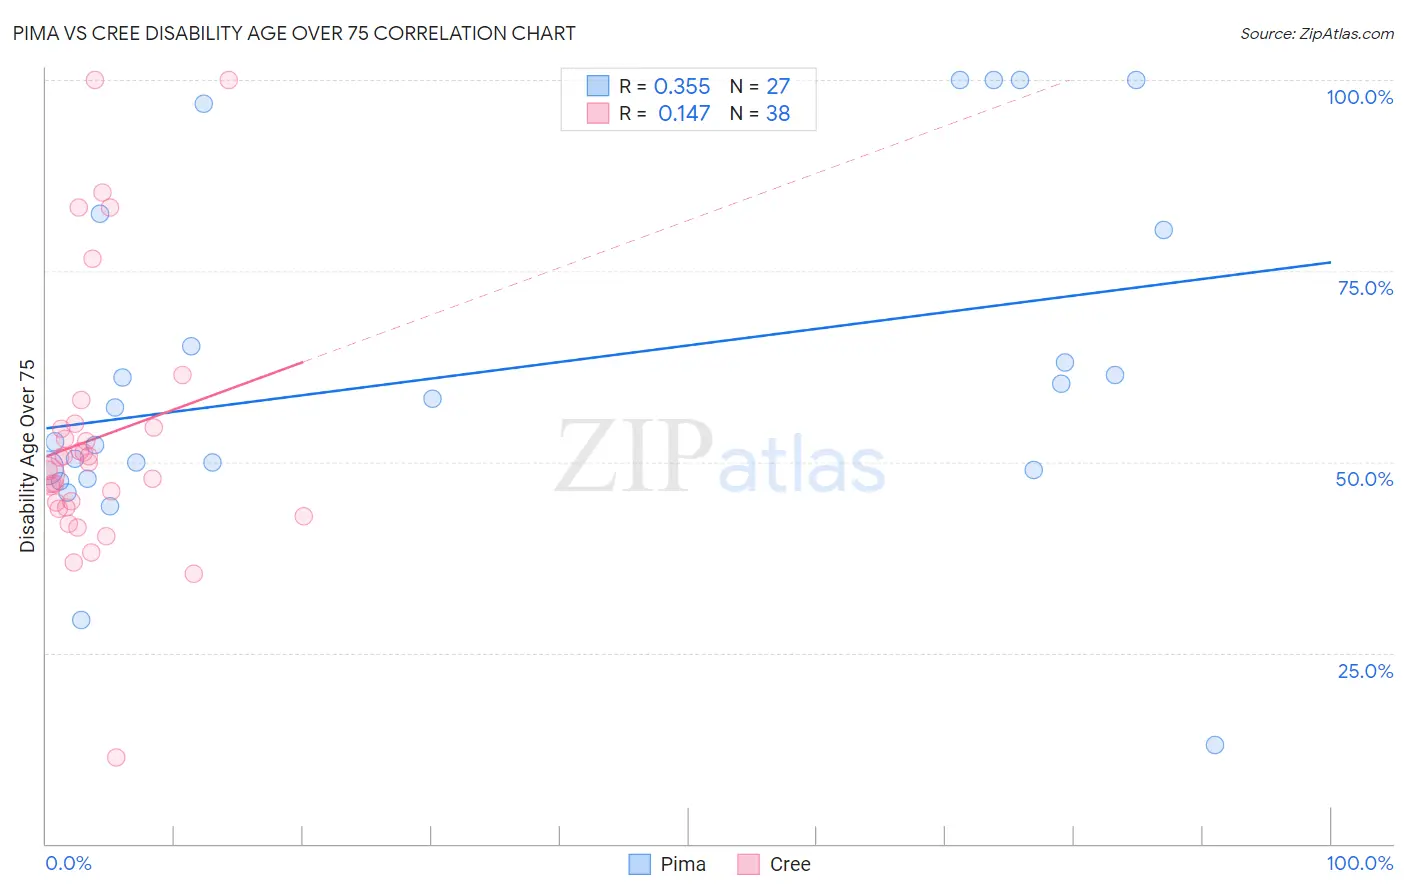
Pima vs Cree Disability Age Over 75 Correlation Chart
The statistical analysis conducted on geographies consisting of 61,521,076 people shows a mild positive correlation between the proportion of Pima and percentage of population with a disability over the age of 75 in the United States with a correlation coefficient (R) of 0.355 and weighted average of 55.8%. Similarly, the statistical analysis conducted on geographies consisting of 76,193,108 people shows a poor positive correlation between the proportion of Cree and percentage of population with a disability over the age of 75 in the United States with a correlation coefficient (R) of 0.147 and weighted average of 48.2%, a difference of 15.9%.
Disability Age Over 75 Correlation Summary
| Measurement | Pima | Cree |
| Minimum | 12.9% | 11.2% |
| Maximum | 100.0% | 100.0% |
| Range | 87.1% | 88.8% |
| Mean | 61.7% | 53.2% |
| Median | 57.1% | 49.4% |
| Interquartile 25% (IQ1) | 48.9% | 44.0% |
| Interquartile 75% (IQ3) | 80.3% | 54.4% |
| Interquartile Range (IQR) | 31.4% | 10.4% |
| Standard Deviation (Sample) | 22.5% | 17.7% |
| Standard Deviation (Population) | 22.1% | 17.5% |
Similar Demographics by Disability Age Over 75
Demographics Similar to Pima by Disability Age Over 75
In terms of disability age over 75, the demographic groups most similar to Pima are Pueblo (55.9%, a difference of 0.080%), Houma (56.2%, a difference of 0.59%), Lumbee (56.2%, a difference of 0.76%), Colville (55.4%, a difference of 0.82%), and Tohono O'odham (56.7%, a difference of 1.6%).
| Demographics | Rating | Rank | Disability Age Over 75 |
| Natives/Alaskans | 0.0 /100 | #332 | Tragic 53.1% |
| Apache | 0.0 /100 | #333 | Tragic 53.6% |
| Alaskan Athabascans | 0.0 /100 | #334 | Tragic 54.0% |
| Kiowa | 0.0 /100 | #335 | Tragic 54.2% |
| Immigrants | Armenia | 0.0 /100 | #336 | Tragic 54.3% |
| Yuman | 0.0 /100 | #337 | Tragic 54.4% |
| Colville | 0.0 /100 | #338 | Tragic 55.4% |
| Pima | 0.0 /100 | #339 | Tragic 55.8% |
| Pueblo | 0.0 /100 | #340 | Tragic 55.9% |
| Houma | 0.0 /100 | #341 | Tragic 56.2% |
| Lumbee | 0.0 /100 | #342 | Tragic 56.2% |
| Tohono O'odham | 0.0 /100 | #343 | Tragic 56.7% |
| Navajo | 0.0 /100 | #344 | Tragic 58.3% |
| Inupiat | 0.0 /100 | #345 | Tragic 58.4% |
| Tsimshian | 0.0 /100 | #346 | Tragic 59.2% |
Demographics Similar to Cree by Disability Age Over 75
In terms of disability age over 75, the demographic groups most similar to Cree are Indonesian (48.2%, a difference of 0.0%), Immigrants (48.2%, a difference of 0.020%), Taiwanese (48.2%, a difference of 0.030%), Subsaharan African (48.2%, a difference of 0.060%), and Hmong (48.2%, a difference of 0.070%).
| Demographics | Rating | Rank | Disability Age Over 75 |
| Immigrants | Nonimmigrants | 6.5 /100 | #226 | Tragic 48.0% |
| Zimbabweans | 6.4 /100 | #227 | Tragic 48.1% |
| Immigrants | Liberia | 5.9 /100 | #228 | Tragic 48.1% |
| Spaniards | 5.7 /100 | #229 | Tragic 48.1% |
| Taiwanese | 4.4 /100 | #230 | Tragic 48.2% |
| Immigrants | Immigrants | 4.3 /100 | #231 | Tragic 48.2% |
| Indonesians | 4.2 /100 | #232 | Tragic 48.2% |
| Cree | 4.2 /100 | #233 | Tragic 48.2% |
| Sub-Saharan Africans | 3.8 /100 | #234 | Tragic 48.2% |
| Hmong | 3.8 /100 | #235 | Tragic 48.2% |
| Immigrants | Nicaragua | 3.2 /100 | #236 | Tragic 48.2% |
| Immigrants | St. Vincent and the Grenadines | 3.2 /100 | #237 | Tragic 48.2% |
| Nicaraguans | 3.0 /100 | #238 | Tragic 48.3% |
| Immigrants | Thailand | 2.8 /100 | #239 | Tragic 48.3% |
| Tongans | 2.3 /100 | #240 | Tragic 48.3% |