Pima vs Palestinian Disability Age Over 75
COMPARE
Pima
Palestinian
Disability Age Over 75
Disability Age Over 75 Comparison
Pima
Palestinians
55.8%
DISABILITY AGE OVER 75
0.0/ 100
METRIC RATING
339th/ 347
METRIC RANK
46.3%
DISABILITY AGE OVER 75
97.7/ 100
METRIC RATING
99th/ 347
METRIC RANK
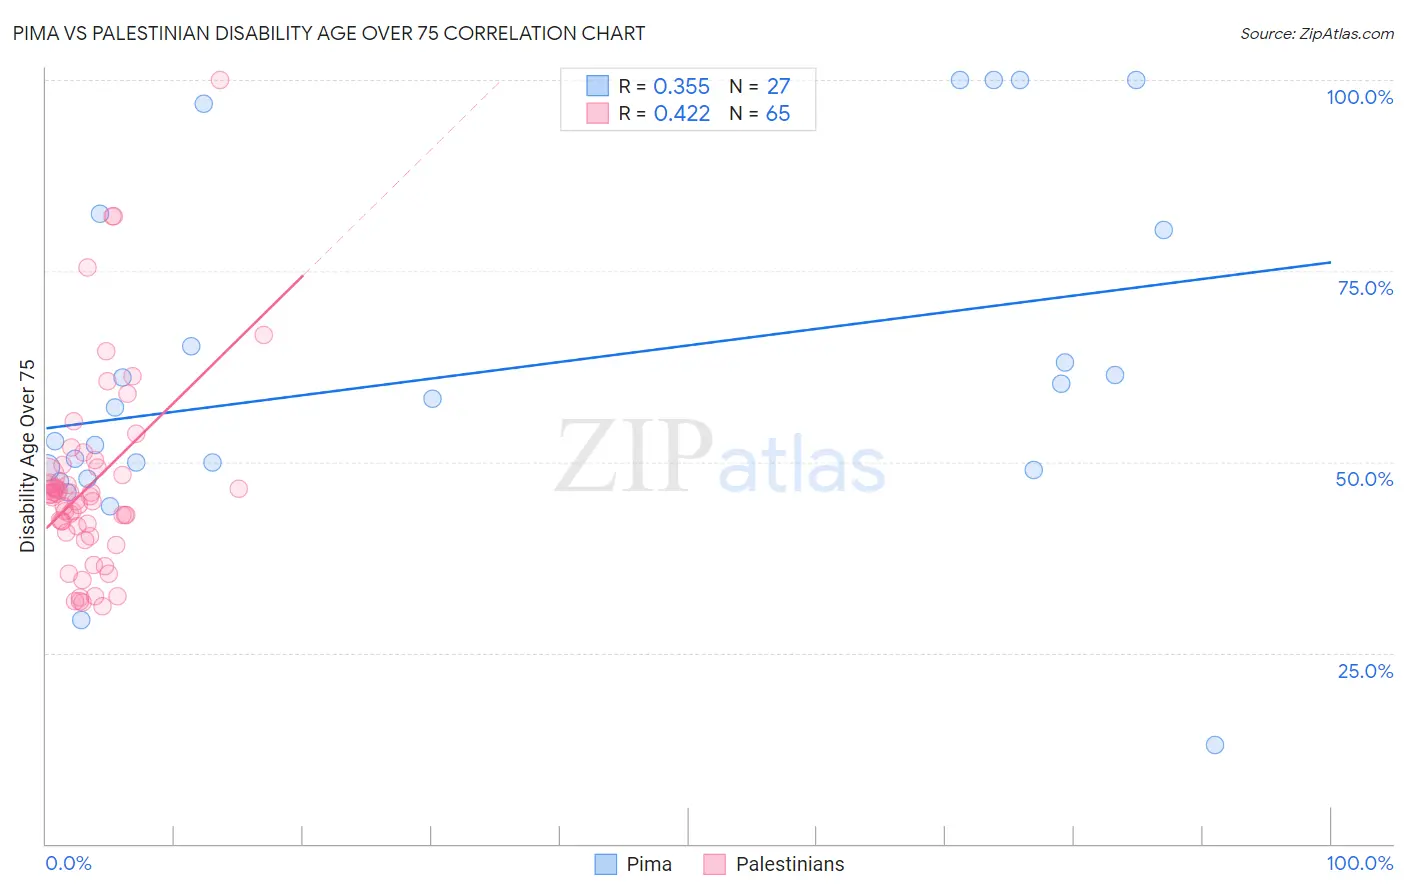
Pima vs Palestinian Disability Age Over 75 Correlation Chart
The statistical analysis conducted on geographies consisting of 61,521,076 people shows a mild positive correlation between the proportion of Pima and percentage of population with a disability over the age of 75 in the United States with a correlation coefficient (R) of 0.355 and weighted average of 55.8%. Similarly, the statistical analysis conducted on geographies consisting of 216,314,084 people shows a moderate positive correlation between the proportion of Palestinians and percentage of population with a disability over the age of 75 in the United States with a correlation coefficient (R) of 0.422 and weighted average of 46.3%, a difference of 20.4%.
Disability Age Over 75 Correlation Summary
| Measurement | Pima | Palestinian |
| Minimum | 12.9% | 31.0% |
| Maximum | 100.0% | 100.0% |
| Range | 87.1% | 69.0% |
| Mean | 61.7% | 47.0% |
| Median | 57.1% | 45.4% |
| Interquartile 25% (IQ1) | 48.9% | 41.2% |
| Interquartile 75% (IQ3) | 80.3% | 48.8% |
| Interquartile Range (IQR) | 31.4% | 7.5% |
| Standard Deviation (Sample) | 22.5% | 12.6% |
| Standard Deviation (Population) | 22.1% | 12.5% |
Similar Demographics by Disability Age Over 75
Demographics Similar to Pima by Disability Age Over 75
In terms of disability age over 75, the demographic groups most similar to Pima are Pueblo (55.9%, a difference of 0.080%), Houma (56.2%, a difference of 0.59%), Lumbee (56.2%, a difference of 0.76%), Colville (55.4%, a difference of 0.82%), and Tohono O'odham (56.7%, a difference of 1.6%).
| Demographics | Rating | Rank | Disability Age Over 75 |
| Natives/Alaskans | 0.0 /100 | #332 | Tragic 53.1% |
| Apache | 0.0 /100 | #333 | Tragic 53.6% |
| Alaskan Athabascans | 0.0 /100 | #334 | Tragic 54.0% |
| Kiowa | 0.0 /100 | #335 | Tragic 54.2% |
| Immigrants | Armenia | 0.0 /100 | #336 | Tragic 54.3% |
| Yuman | 0.0 /100 | #337 | Tragic 54.4% |
| Colville | 0.0 /100 | #338 | Tragic 55.4% |
| Pima | 0.0 /100 | #339 | Tragic 55.8% |
| Pueblo | 0.0 /100 | #340 | Tragic 55.9% |
| Houma | 0.0 /100 | #341 | Tragic 56.2% |
| Lumbee | 0.0 /100 | #342 | Tragic 56.2% |
| Tohono O'odham | 0.0 /100 | #343 | Tragic 56.7% |
| Navajo | 0.0 /100 | #344 | Tragic 58.3% |
| Inupiat | 0.0 /100 | #345 | Tragic 58.4% |
| Tsimshian | 0.0 /100 | #346 | Tragic 59.2% |
Demographics Similar to Palestinians by Disability Age Over 75
In terms of disability age over 75, the demographic groups most similar to Palestinians are Immigrants from Eastern Europe (46.3%, a difference of 0.0%), Mongolian (46.3%, a difference of 0.0%), Immigrants from Japan (46.3%, a difference of 0.040%), Finnish (46.3%, a difference of 0.050%), and Immigrants from China (46.3%, a difference of 0.070%).
| Demographics | Rating | Rank | Disability Age Over 75 |
| Germans | 98.2 /100 | #92 | Exceptional 46.3% |
| Ugandans | 98.2 /100 | #93 | Exceptional 46.3% |
| Albanians | 98.1 /100 | #94 | Exceptional 46.3% |
| Immigrants | Brazil | 98.0 /100 | #95 | Exceptional 46.3% |
| Immigrants | China | 98.0 /100 | #96 | Exceptional 46.3% |
| Finns | 97.9 /100 | #97 | Exceptional 46.3% |
| Immigrants | Japan | 97.8 /100 | #98 | Exceptional 46.3% |
| Palestinians | 97.7 /100 | #99 | Exceptional 46.3% |
| Immigrants | Eastern Europe | 97.7 /100 | #100 | Exceptional 46.3% |
| Mongolians | 97.7 /100 | #101 | Exceptional 46.3% |
| Immigrants | Malaysia | 97.1 /100 | #102 | Exceptional 46.4% |
| Ukrainians | 97.1 /100 | #103 | Exceptional 46.4% |
| Israelis | 97.0 /100 | #104 | Exceptional 46.4% |
| Immigrants | Cameroon | 96.9 /100 | #105 | Exceptional 46.4% |
| Immigrants | Kuwait | 96.8 /100 | #106 | Exceptional 46.4% |