Peruvian vs Immigrants from England 3rd Grade
COMPARE
Peruvian
Immigrants from England
3rd Grade
3rd Grade Comparison
Peruvians
Immigrants from England
97.4%
3RD GRADE
0.8/ 100
METRIC RATING
252nd/ 347
METRIC RANK
98.2%
3RD GRADE
99.2/ 100
METRIC RATING
76th/ 347
METRIC RANK
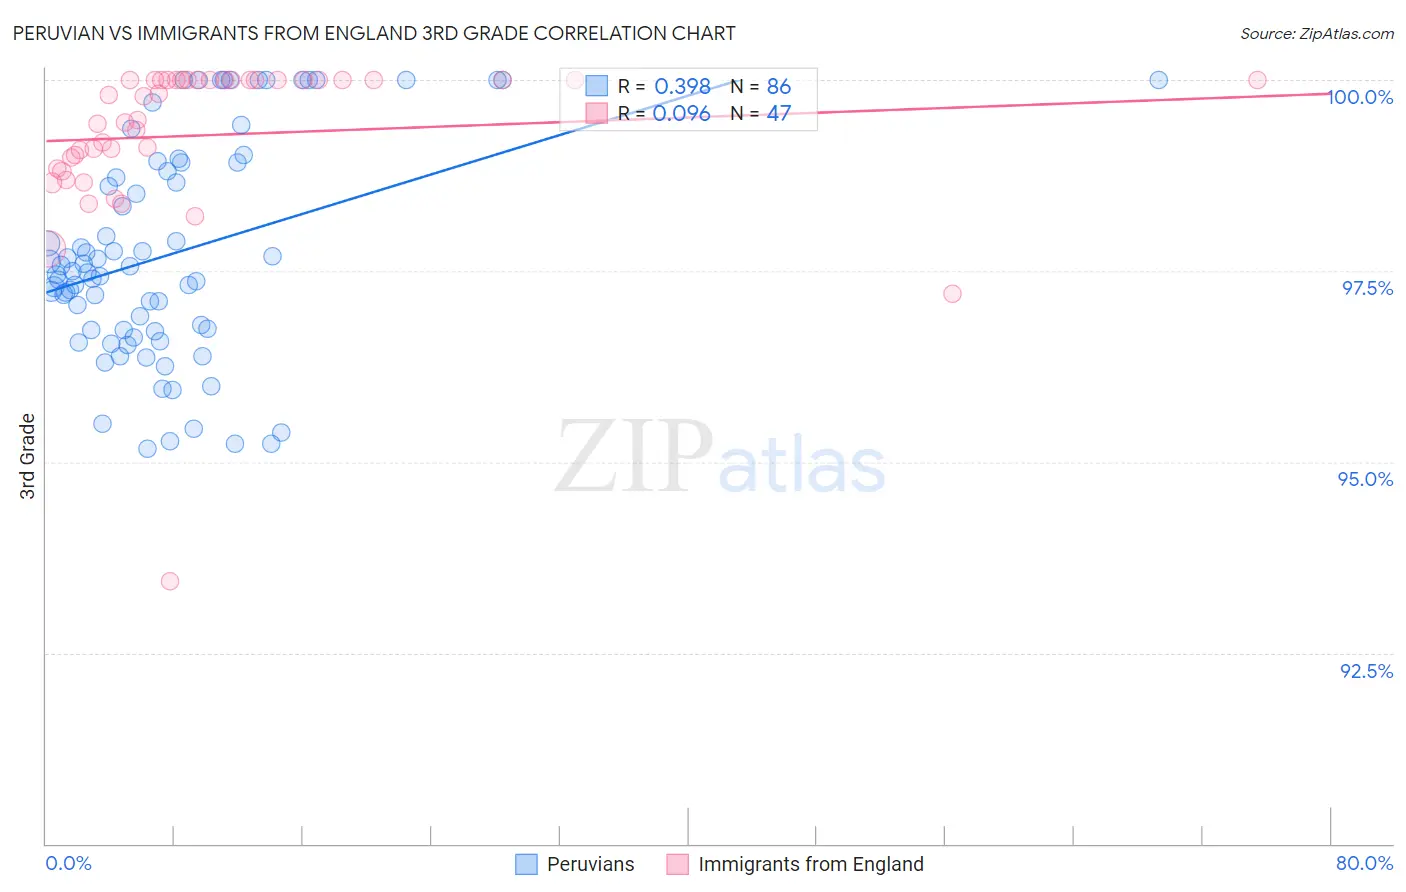
Peruvian vs Immigrants from England 3rd Grade Correlation Chart
The statistical analysis conducted on geographies consisting of 363,068,462 people shows a mild positive correlation between the proportion of Peruvians and percentage of population with at least 3rd grade education in the United States with a correlation coefficient (R) of 0.398 and weighted average of 97.4%. Similarly, the statistical analysis conducted on geographies consisting of 391,898,018 people shows a slight positive correlation between the proportion of Immigrants from England and percentage of population with at least 3rd grade education in the United States with a correlation coefficient (R) of 0.096 and weighted average of 98.2%, a difference of 0.82%.
3rd Grade Correlation Summary
| Measurement | Peruvian | Immigrants from England |
| Minimum | 95.2% | 93.4% |
| Maximum | 100.0% | 100.0% |
| Range | 4.8% | 6.6% |
| Mean | 97.7% | 99.3% |
| Median | 97.5% | 99.8% |
| Interquartile 25% (IQ1) | 96.7% | 98.8% |
| Interquartile 75% (IQ3) | 98.9% | 100.0% |
| Interquartile Range (IQR) | 2.2% | 1.2% |
| Standard Deviation (Sample) | 1.4% | 1.1% |
| Standard Deviation (Population) | 1.4% | 1.1% |
Similar Demographics by 3rd Grade
Demographics Similar to Peruvians by 3rd Grade
In terms of 3rd grade, the demographic groups most similar to Peruvians are Immigrants from Asia (97.4%, a difference of 0.0%), Immigrants from Africa (97.4%, a difference of 0.0%), Immigrants from Eastern Africa (97.4%, a difference of 0.010%), South American (97.4%, a difference of 0.010%), and Immigrants from Middle Africa (97.4%, a difference of 0.010%).
| Demographics | Rating | Rank | 3rd Grade |
| Ethiopians | 1.1 /100 | #245 | Tragic 97.4% |
| Immigrants | Senegal | 1.0 /100 | #246 | Tragic 97.4% |
| Assyrians/Chaldeans/Syriacs | 1.0 /100 | #247 | Tragic 97.4% |
| Immigrants | Eastern Africa | 0.9 /100 | #248 | Tragic 97.4% |
| South Americans | 0.9 /100 | #249 | Tragic 97.4% |
| Immigrants | Middle Africa | 0.9 /100 | #250 | Tragic 97.4% |
| Immigrants | Asia | 0.8 /100 | #251 | Tragic 97.4% |
| Peruvians | 0.8 /100 | #252 | Tragic 97.4% |
| Immigrants | Africa | 0.8 /100 | #253 | Tragic 97.4% |
| Jamaicans | 0.7 /100 | #254 | Tragic 97.4% |
| Bolivians | 0.6 /100 | #255 | Tragic 97.3% |
| Immigrants | Congo | 0.6 /100 | #256 | Tragic 97.3% |
| Immigrants | Colombia | 0.5 /100 | #257 | Tragic 97.3% |
| Immigrants | Liberia | 0.5 /100 | #258 | Tragic 97.3% |
| Armenians | 0.4 /100 | #259 | Tragic 97.3% |
Demographics Similar to Immigrants from England by 3rd Grade
In terms of 3rd grade, the demographic groups most similar to Immigrants from England are Immigrants from Netherlands (98.2%, a difference of 0.0%), Cherokee (98.2%, a difference of 0.0%), Immigrants from Lithuania (98.2%, a difference of 0.0%), Cheyenne (98.2%, a difference of 0.010%), and Osage (98.2%, a difference of 0.010%).
| Demographics | Rating | Rank | 3rd Grade |
| Canadians | 99.6 /100 | #69 | Exceptional 98.2% |
| Cajuns | 99.6 /100 | #70 | Exceptional 98.2% |
| Immigrants | Austria | 99.6 /100 | #71 | Exceptional 98.2% |
| Chickasaw | 99.5 /100 | #72 | Exceptional 98.2% |
| Cheyenne | 99.3 /100 | #73 | Exceptional 98.2% |
| Immigrants | Netherlands | 99.3 /100 | #74 | Exceptional 98.2% |
| Cherokee | 99.3 /100 | #75 | Exceptional 98.2% |
| Immigrants | England | 99.2 /100 | #76 | Exceptional 98.2% |
| Immigrants | Lithuania | 99.2 /100 | #77 | Exceptional 98.2% |
| Osage | 99.2 /100 | #78 | Exceptional 98.2% |
| Immigrants | Belgium | 99.1 /100 | #79 | Exceptional 98.1% |
| Macedonians | 99.1 /100 | #80 | Exceptional 98.1% |
| Icelanders | 99.1 /100 | #81 | Exceptional 98.1% |
| Shoshone | 99.0 /100 | #82 | Exceptional 98.1% |
| Ukrainians | 98.9 /100 | #83 | Exceptional 98.1% |