Immigrants from China vs Immigrants from England Male Disability
COMPARE
Immigrants from China
Immigrants from England
Male Disability
Male Disability Comparison
Immigrants from China
Immigrants from England
9.5%
MALE DISABILITY
100.0/ 100
METRIC RATING
8th/ 347
METRIC RANK
11.7%
MALE DISABILITY
4.0/ 100
METRIC RATING
218th/ 347
METRIC RANK
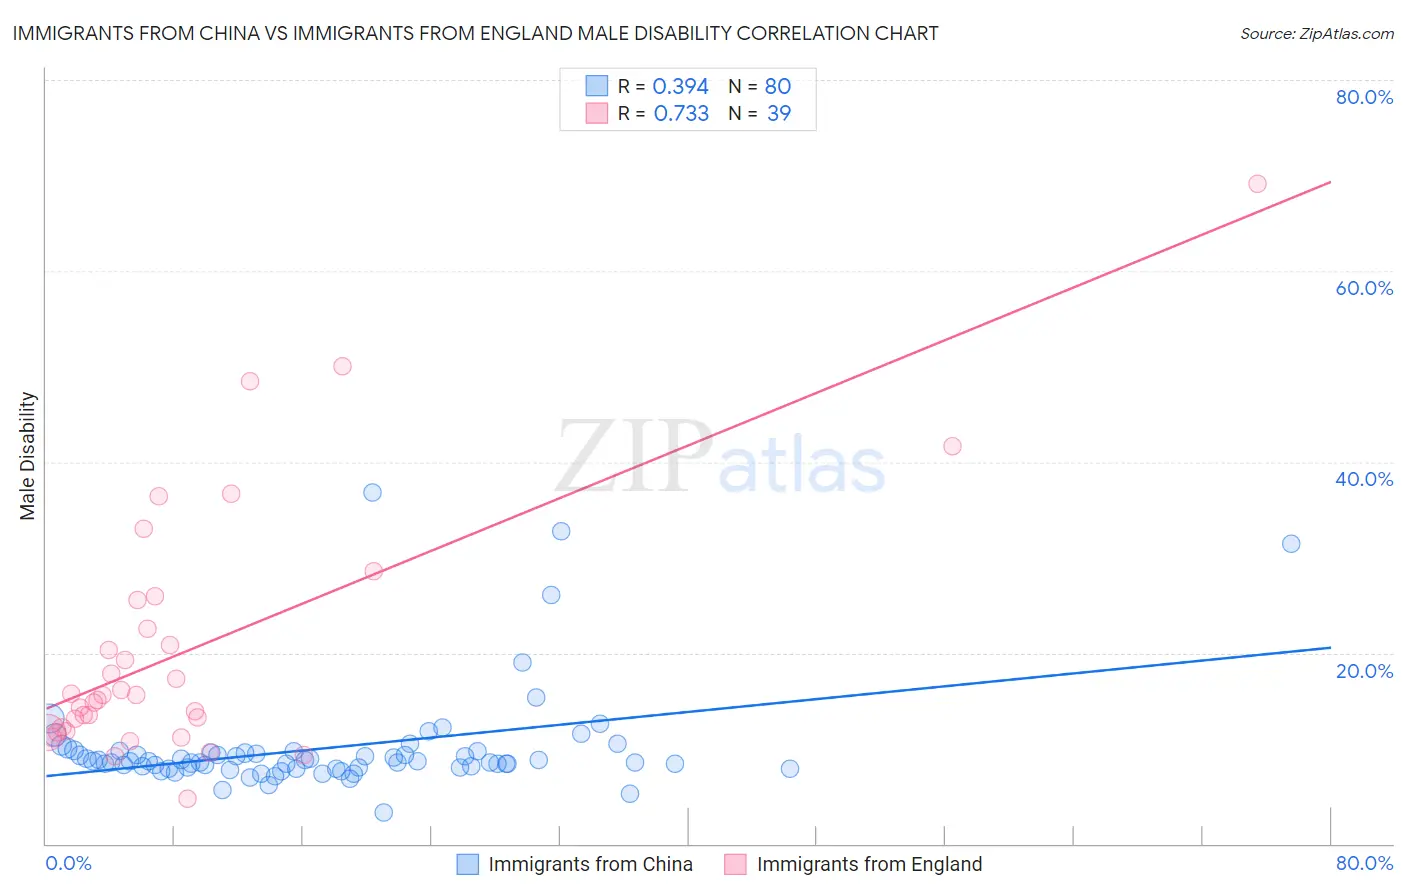
Immigrants from China vs Immigrants from England Male Disability Correlation Chart
The statistical analysis conducted on geographies consisting of 457,000,034 people shows a mild positive correlation between the proportion of Immigrants from China and percentage of males with a disability in the United States with a correlation coefficient (R) of 0.394 and weighted average of 9.5%. Similarly, the statistical analysis conducted on geographies consisting of 391,879,882 people shows a strong positive correlation between the proportion of Immigrants from England and percentage of males with a disability in the United States with a correlation coefficient (R) of 0.733 and weighted average of 11.7%, a difference of 23.0%.
Male Disability Correlation Summary
| Measurement | Immigrants from China | Immigrants from England |
| Minimum | 3.2% | 4.7% |
| Maximum | 36.8% | 69.2% |
| Range | 33.5% | 64.4% |
| Mean | 10.0% | 20.5% |
| Median | 8.6% | 15.5% |
| Interquartile 25% (IQ1) | 8.0% | 11.8% |
| Interquartile 75% (IQ3) | 9.6% | 25.5% |
| Interquartile Range (IQR) | 1.6% | 13.6% |
| Standard Deviation (Sample) | 5.5% | 13.5% |
| Standard Deviation (Population) | 5.4% | 13.3% |
Similar Demographics by Male Disability
Demographics Similar to Immigrants from China by Male Disability
In terms of male disability, the demographic groups most similar to Immigrants from China are Immigrants from Singapore (9.5%, a difference of 0.080%), Immigrants from Israel (9.6%, a difference of 0.51%), Immigrants from Bolivia (9.5%, a difference of 0.60%), Immigrants from South Central Asia (9.4%, a difference of 0.93%), and Immigrants from Hong Kong (9.4%, a difference of 0.99%).
| Demographics | Rating | Rank | Male Disability |
| Immigrants | India | 100.0 /100 | #1 | Exceptional 9.0% |
| Immigrants | Taiwan | 100.0 /100 | #2 | Exceptional 9.1% |
| Filipinos | 100.0 /100 | #3 | Exceptional 9.1% |
| Thais | 100.0 /100 | #4 | Exceptional 9.2% |
| Immigrants | Hong Kong | 100.0 /100 | #5 | Exceptional 9.4% |
| Immigrants | South Central Asia | 100.0 /100 | #6 | Exceptional 9.4% |
| Immigrants | Bolivia | 100.0 /100 | #7 | Exceptional 9.5% |
| Immigrants | China | 100.0 /100 | #8 | Exceptional 9.5% |
| Immigrants | Singapore | 100.0 /100 | #9 | Exceptional 9.5% |
| Immigrants | Israel | 100.0 /100 | #10 | Exceptional 9.6% |
| Immigrants | Eastern Asia | 100.0 /100 | #11 | Exceptional 9.6% |
| Bolivians | 100.0 /100 | #12 | Exceptional 9.6% |
| Iranians | 100.0 /100 | #13 | Exceptional 9.7% |
| Immigrants | Iran | 100.0 /100 | #14 | Exceptional 9.7% |
| Indians (Asian) | 100.0 /100 | #15 | Exceptional 9.7% |
Demographics Similar to Immigrants from England by Male Disability
In terms of male disability, the demographic groups most similar to Immigrants from England are Panamanian (11.7%, a difference of 0.060%), Immigrants from Western Europe (11.7%, a difference of 0.070%), Immigrants from Congo (11.7%, a difference of 0.080%), Immigrants from Dominica (11.7%, a difference of 0.21%), and Alsatian (11.7%, a difference of 0.23%).
| Demographics | Rating | Rank | Male Disability |
| Immigrants | Thailand | 8.4 /100 | #211 | Tragic 11.6% |
| Immigrants | Scotland | 8.2 /100 | #212 | Tragic 11.6% |
| Mexican American Indians | 7.8 /100 | #213 | Tragic 11.6% |
| Lithuanians | 6.6 /100 | #214 | Tragic 11.6% |
| Indonesians | 5.9 /100 | #215 | Tragic 11.6% |
| Immigrants | Dominican Republic | 4.9 /100 | #216 | Tragic 11.7% |
| Immigrants | Dominica | 4.6 /100 | #217 | Tragic 11.7% |
| Immigrants | England | 4.0 /100 | #218 | Tragic 11.7% |
| Panamanians | 3.8 /100 | #219 | Tragic 11.7% |
| Immigrants | Western Europe | 3.8 /100 | #220 | Tragic 11.7% |
| Immigrants | Congo | 3.7 /100 | #221 | Tragic 11.7% |
| Alsatians | 3.3 /100 | #222 | Tragic 11.7% |
| Immigrants | Bahamas | 3.2 /100 | #223 | Tragic 11.7% |
| Japanese | 3.1 /100 | #224 | Tragic 11.7% |
| Liberians | 3.1 /100 | #225 | Tragic 11.8% |