Peruvian vs Immigrants from Europe Hearing Disability
COMPARE
Peruvian
Immigrants from Europe
Hearing Disability
Hearing Disability Comparison
Peruvians
Immigrants from Europe
2.7%
HEARING DISABILITY
97.7/ 100
METRIC RATING
70th/ 347
METRIC RANK
3.1%
HEARING DISABILITY
22.9/ 100
METRIC RATING
196th/ 347
METRIC RANK
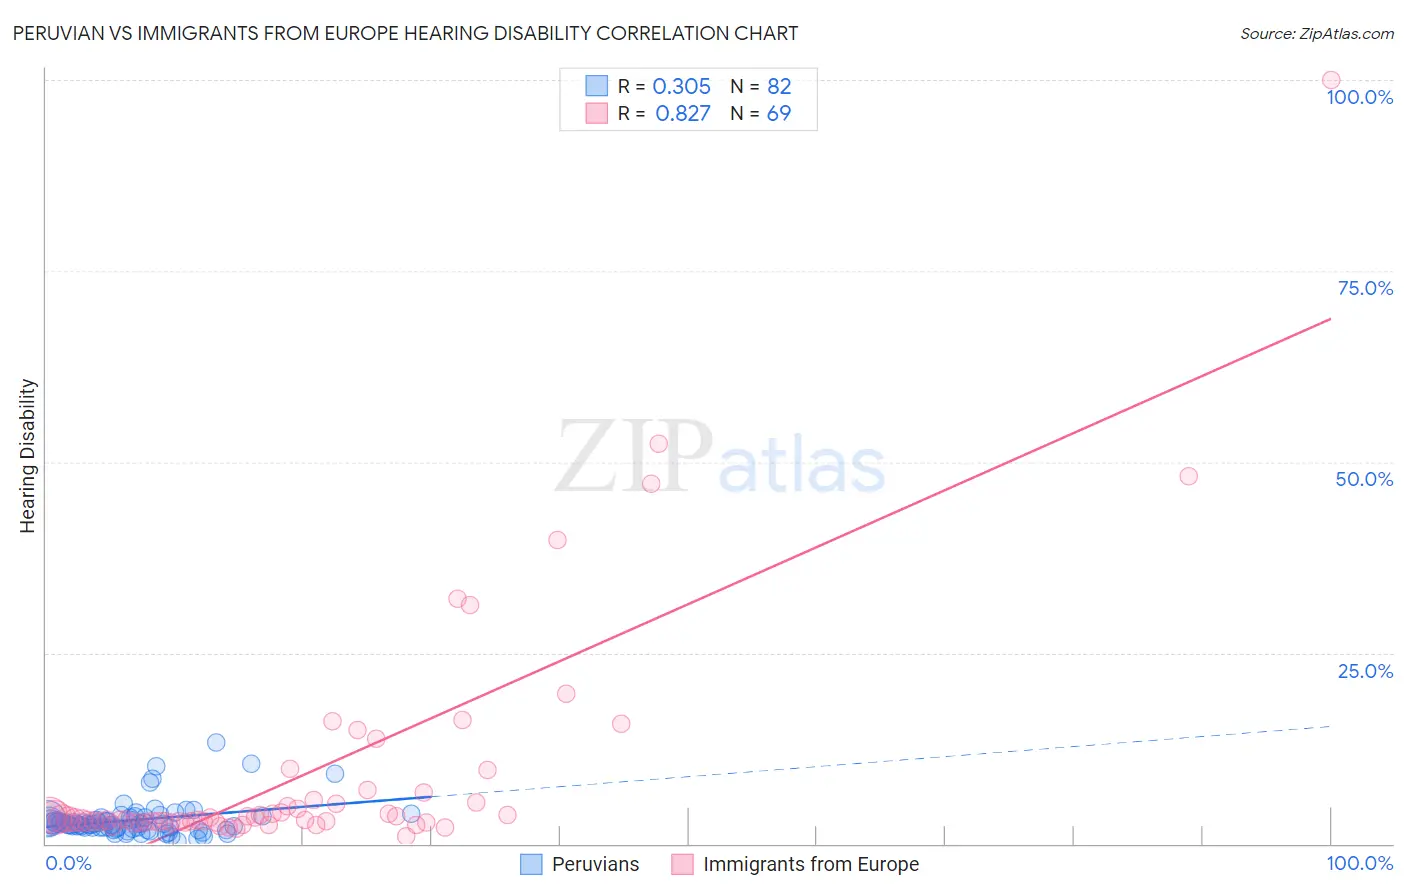
Peruvian vs Immigrants from Europe Hearing Disability Correlation Chart
The statistical analysis conducted on geographies consisting of 363,103,364 people shows a mild positive correlation between the proportion of Peruvians and percentage of population with hearing disability in the United States with a correlation coefficient (R) of 0.305 and weighted average of 2.7%. Similarly, the statistical analysis conducted on geographies consisting of 546,917,767 people shows a very strong positive correlation between the proportion of Immigrants from Europe and percentage of population with hearing disability in the United States with a correlation coefficient (R) of 0.827 and weighted average of 3.1%, a difference of 12.8%.
Hearing Disability Correlation Summary
| Measurement | Peruvian | Immigrants from Europe |
| Minimum | 0.31% | 0.95% |
| Maximum | 13.2% | 100.0% |
| Range | 12.9% | 99.1% |
| Mean | 3.1% | 9.4% |
| Median | 2.6% | 3.2% |
| Interquartile 25% (IQ1) | 2.1% | 2.9% |
| Interquartile 75% (IQ3) | 3.2% | 6.2% |
| Interquartile Range (IQR) | 1.2% | 3.3% |
| Standard Deviation (Sample) | 2.2% | 15.9% |
| Standard Deviation (Population) | 2.2% | 15.8% |
Similar Demographics by Hearing Disability
Demographics Similar to Peruvians by Hearing Disability
In terms of hearing disability, the demographic groups most similar to Peruvians are Central American (2.7%, a difference of 0.050%), Afghan (2.7%, a difference of 0.15%), Nicaraguan (2.7%, a difference of 0.23%), Argentinean (2.7%, a difference of 0.23%), and Immigrants from Korea (2.7%, a difference of 0.23%).
| Demographics | Rating | Rank | Hearing Disability |
| Indians (Asian) | 98.4 /100 | #63 | Exceptional 2.7% |
| Immigrants | Sri Lanka | 98.4 /100 | #64 | Exceptional 2.7% |
| Immigrants | Nepal | 98.3 /100 | #65 | Exceptional 2.7% |
| Immigrants | Belize | 98.2 /100 | #66 | Exceptional 2.7% |
| Egyptians | 98.1 /100 | #67 | Exceptional 2.7% |
| Immigrants | Africa | 98.0 /100 | #68 | Exceptional 2.7% |
| Nicaraguans | 97.9 /100 | #69 | Exceptional 2.7% |
| Peruvians | 97.7 /100 | #70 | Exceptional 2.7% |
| Central Americans | 97.7 /100 | #71 | Exceptional 2.7% |
| Afghans | 97.6 /100 | #72 | Exceptional 2.7% |
| Argentineans | 97.5 /100 | #73 | Exceptional 2.7% |
| Immigrants | Korea | 97.5 /100 | #74 | Exceptional 2.7% |
| Immigrants | Saudi Arabia | 97.5 /100 | #75 | Exceptional 2.7% |
| Asians | 97.5 /100 | #76 | Exceptional 2.7% |
| Immigrants | Malaysia | 97.5 /100 | #77 | Exceptional 2.7% |
Demographics Similar to Immigrants from Europe by Hearing Disability
In terms of hearing disability, the demographic groups most similar to Immigrants from Europe are Spanish American Indian (3.1%, a difference of 0.16%), South African (3.1%, a difference of 0.21%), Immigrants from Bosnia and Herzegovina (3.1%, a difference of 0.30%), Immigrants from Croatia (3.1%, a difference of 0.32%), and Macedonian (3.1%, a difference of 0.51%).
| Demographics | Rating | Rank | Hearing Disability |
| Africans | 32.9 /100 | #189 | Fair 3.0% |
| Immigrants | South Africa | 31.1 /100 | #190 | Fair 3.1% |
| Immigrants | Switzerland | 28.8 /100 | #191 | Fair 3.1% |
| Koreans | 27.6 /100 | #192 | Fair 3.1% |
| Macedonians | 27.0 /100 | #193 | Fair 3.1% |
| South Africans | 24.5 /100 | #194 | Fair 3.1% |
| Spanish American Indians | 24.1 /100 | #195 | Fair 3.1% |
| Immigrants | Europe | 22.9 /100 | #196 | Fair 3.1% |
| Immigrants | Bosnia and Herzegovina | 20.6 /100 | #197 | Fair 3.1% |
| Immigrants | Croatia | 20.5 /100 | #198 | Fair 3.1% |
| Syrians | 19.2 /100 | #199 | Poor 3.1% |
| Immigrants | North Macedonia | 19.1 /100 | #200 | Poor 3.1% |
| Iraqis | 19.0 /100 | #201 | Poor 3.1% |
| Immigrants | Thailand | 16.4 /100 | #202 | Poor 3.1% |
| Immigrants | Denmark | 16.2 /100 | #203 | Poor 3.1% |