Immigrants from France vs Somali Vision Disability
COMPARE
Immigrants from France
Somali
Vision Disability
Vision Disability Comparison
Immigrants from France
Somalis
2.0%
VISION DISABILITY
98.5/ 100
METRIC RATING
72nd/ 347
METRIC RANK
2.0%
VISION DISABILITY
99.2/ 100
METRIC RATING
57th/ 347
METRIC RANK
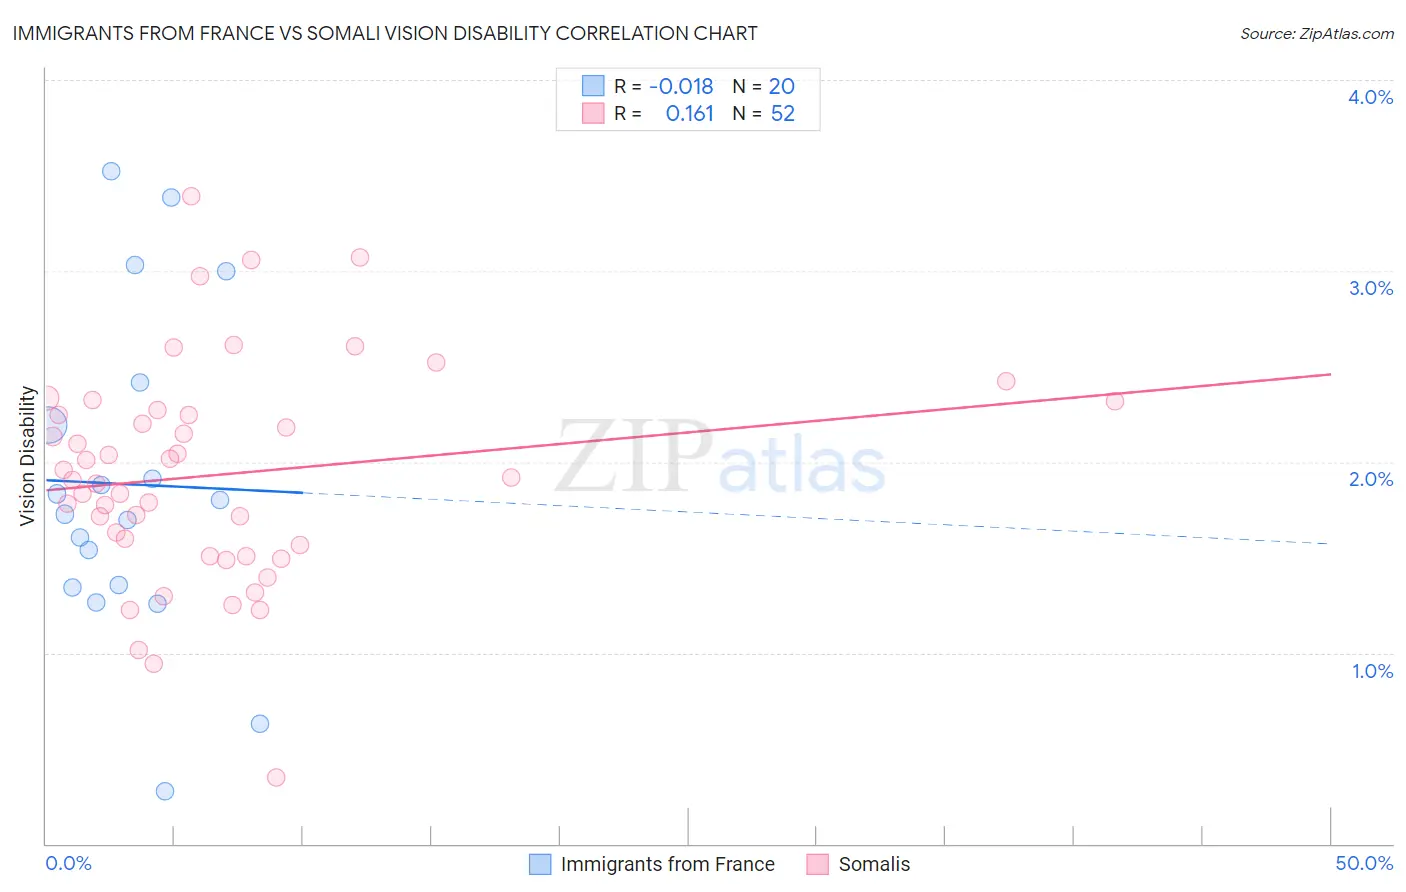
Immigrants from France vs Somali Vision Disability Correlation Chart
The statistical analysis conducted on geographies consisting of 287,766,999 people shows no correlation between the proportion of Immigrants from France and percentage of population with vision disability in the United States with a correlation coefficient (R) of -0.018 and weighted average of 2.0%. Similarly, the statistical analysis conducted on geographies consisting of 99,264,123 people shows a poor positive correlation between the proportion of Somalis and percentage of population with vision disability in the United States with a correlation coefficient (R) of 0.161 and weighted average of 2.0%, a difference of 1.1%.
Vision Disability Correlation Summary
| Measurement | Immigrants from France | Somali |
| Minimum | 0.28% | 0.35% |
| Maximum | 3.5% | 3.4% |
| Range | 3.2% | 3.0% |
| Mean | 1.9% | 1.9% |
| Median | 1.8% | 1.9% |
| Interquartile 25% (IQ1) | 1.3% | 1.5% |
| Interquartile 75% (IQ3) | 2.3% | 2.3% |
| Interquartile Range (IQR) | 0.96% | 0.72% |
| Standard Deviation (Sample) | 0.85% | 0.58% |
| Standard Deviation (Population) | 0.83% | 0.57% |
Demographics Similar to Immigrants from France and Somalis by Vision Disability
In terms of vision disability, the demographic groups most similar to Immigrants from France are Immigrants from Northern Europe (2.0%, a difference of 0.050%), Immigrants from Kazakhstan (2.0%, a difference of 0.060%), Russian (2.0%, a difference of 0.080%), Immigrants from Eritrea (2.0%, a difference of 0.20%), and Immigrants from Czechoslovakia (2.0%, a difference of 0.25%). Similarly, the demographic groups most similar to Somalis are Jordanian (2.0%, a difference of 0.020%), Immigrants from Saudi Arabia (2.0%, a difference of 0.070%), Laotian (2.0%, a difference of 0.19%), Argentinean (2.0%, a difference of 0.21%), and Macedonian (2.0%, a difference of 0.24%).
| Demographics | Rating | Rank | Vision Disability |
| Macedonians | 99.3 /100 | #54 | Exceptional 2.0% |
| Laotians | 99.3 /100 | #55 | Exceptional 2.0% |
| Jordanians | 99.2 /100 | #56 | Exceptional 2.0% |
| Somalis | 99.2 /100 | #57 | Exceptional 2.0% |
| Immigrants | Saudi Arabia | 99.2 /100 | #58 | Exceptional 2.0% |
| Argentineans | 99.1 /100 | #59 | Exceptional 2.0% |
| Immigrants | Romania | 99.1 /100 | #60 | Exceptional 2.0% |
| Immigrants | Belgium | 99.1 /100 | #61 | Exceptional 2.0% |
| Immigrants | Russia | 99.1 /100 | #62 | Exceptional 2.0% |
| Armenians | 99.0 /100 | #63 | Exceptional 2.0% |
| Immigrants | Greece | 99.0 /100 | #64 | Exceptional 2.0% |
| Maltese | 98.9 /100 | #65 | Exceptional 2.0% |
| Immigrants | Argentina | 98.9 /100 | #66 | Exceptional 2.0% |
| Immigrants | Northern Africa | 98.8 /100 | #67 | Exceptional 2.0% |
| Immigrants | Czechoslovakia | 98.7 /100 | #68 | Exceptional 2.0% |
| Russians | 98.6 /100 | #69 | Exceptional 2.0% |
| Immigrants | Kazakhstan | 98.6 /100 | #70 | Exceptional 2.0% |
| Immigrants | Northern Europe | 98.6 /100 | #71 | Exceptional 2.0% |
| Immigrants | France | 98.5 /100 | #72 | Exceptional 2.0% |
| Immigrants | Eritrea | 98.4 /100 | #73 | Exceptional 2.0% |
| Palestinians | 98.3 /100 | #74 | Exceptional 2.0% |