Paraguayan vs Somali 3rd Grade
COMPARE
Paraguayan
Somali
3rd Grade
3rd Grade Comparison
Paraguayans
Somalis
97.7%
3RD GRADE
26.2/ 100
METRIC RATING
196th/ 347
METRIC RANK
96.8%
3RD GRADE
0.0/ 100
METRIC RATING
299th/ 347
METRIC RANK
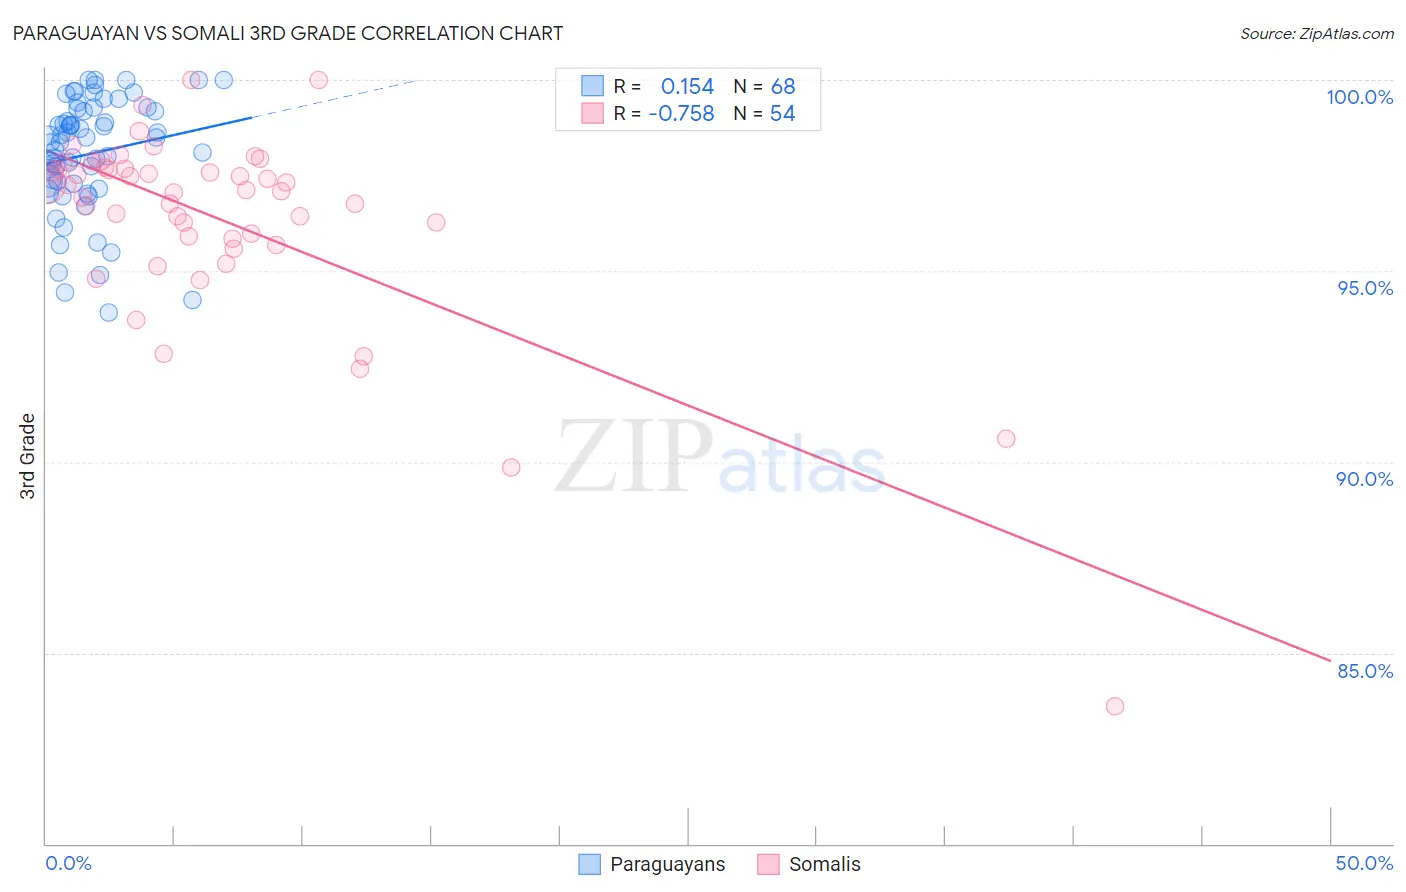
Paraguayan vs Somali 3rd Grade Correlation Chart
The statistical analysis conducted on geographies consisting of 95,115,093 people shows a poor positive correlation between the proportion of Paraguayans and percentage of population with at least 3rd grade education in the United States with a correlation coefficient (R) of 0.154 and weighted average of 97.7%. Similarly, the statistical analysis conducted on geographies consisting of 99,332,457 people shows a strong negative correlation between the proportion of Somalis and percentage of population with at least 3rd grade education in the United States with a correlation coefficient (R) of -0.758 and weighted average of 96.8%, a difference of 0.86%.
3rd Grade Correlation Summary
| Measurement | Paraguayan | Somali |
| Minimum | 93.9% | 83.6% |
| Maximum | 100.0% | 100.0% |
| Range | 6.1% | 16.4% |
| Mean | 98.1% | 96.3% |
| Median | 98.4% | 97.1% |
| Interquartile 25% (IQ1) | 97.3% | 95.8% |
| Interquartile 75% (IQ3) | 99.2% | 97.7% |
| Interquartile Range (IQR) | 1.9% | 1.8% |
| Standard Deviation (Sample) | 1.5% | 2.7% |
| Standard Deviation (Population) | 1.5% | 2.7% |
Similar Demographics by 3rd Grade
Demographics Similar to Paraguayans by 3rd Grade
In terms of 3rd grade, the demographic groups most similar to Paraguayans are Immigrants from Egypt (97.7%, a difference of 0.0%), Hawaiian (97.7%, a difference of 0.0%), Black/African American (97.7%, a difference of 0.010%), Mongolian (97.7%, a difference of 0.010%), and Immigrants from Kenya (97.7%, a difference of 0.010%).
| Demographics | Rating | Rank | 3rd Grade |
| Pakistanis | 34.2 /100 | #189 | Fair 97.7% |
| Panamanians | 31.5 /100 | #190 | Fair 97.7% |
| Blacks/African Americans | 29.6 /100 | #191 | Fair 97.7% |
| Mongolians | 29.1 /100 | #192 | Fair 97.7% |
| Immigrants | Kenya | 28.2 /100 | #193 | Fair 97.7% |
| Immigrants | Uganda | 27.4 /100 | #194 | Fair 97.7% |
| Immigrants | Egypt | 26.8 /100 | #195 | Fair 97.7% |
| Paraguayans | 26.2 /100 | #196 | Fair 97.7% |
| Hawaiians | 25.7 /100 | #197 | Fair 97.7% |
| Guamanians/Chamorros | 23.6 /100 | #198 | Fair 97.7% |
| Immigrants | Ukraine | 22.7 /100 | #199 | Fair 97.7% |
| Immigrants | Albania | 22.6 /100 | #200 | Fair 97.7% |
| Immigrants | Lebanon | 21.7 /100 | #201 | Fair 97.7% |
| Immigrants | Southern Europe | 17.7 /100 | #202 | Poor 97.6% |
| Paiute | 16.7 /100 | #203 | Poor 97.6% |
Demographics Similar to Somalis by 3rd Grade
In terms of 3rd grade, the demographic groups most similar to Somalis are Immigrants from Dominica (96.9%, a difference of 0.010%), Immigrants from South Eastern Asia (96.8%, a difference of 0.010%), Haitian (96.9%, a difference of 0.020%), Immigrants from Cuba (96.8%, a difference of 0.020%), and Immigrants (96.9%, a difference of 0.040%).
| Demographics | Rating | Rank | 3rd Grade |
| British West Indians | 0.0 /100 | #292 | Tragic 97.0% |
| Immigrants | Grenada | 0.0 /100 | #293 | Tragic 97.0% |
| Malaysians | 0.0 /100 | #294 | Tragic 97.0% |
| Immigrants | Eritrea | 0.0 /100 | #295 | Tragic 97.0% |
| Immigrants | Immigrants | 0.0 /100 | #296 | Tragic 96.9% |
| Haitians | 0.0 /100 | #297 | Tragic 96.9% |
| Immigrants | Dominica | 0.0 /100 | #298 | Tragic 96.9% |
| Somalis | 0.0 /100 | #299 | Tragic 96.8% |
| Immigrants | South Eastern Asia | 0.0 /100 | #300 | Tragic 96.8% |
| Immigrants | Cuba | 0.0 /100 | #301 | Tragic 96.8% |
| Immigrants | Somalia | 0.0 /100 | #302 | Tragic 96.8% |
| Ecuadorians | 0.0 /100 | #303 | Tragic 96.7% |
| Immigrants | Caribbean | 0.0 /100 | #304 | Tragic 96.7% |
| Central American Indians | 0.0 /100 | #305 | Tragic 96.7% |
| Guyanese | 0.0 /100 | #306 | Tragic 96.7% |