Mexican American Indian vs Somali Vision Disability
COMPARE
Mexican American Indian
Somali
Vision Disability
Vision Disability Comparison
Mexican American Indians
Somalis
2.4%
VISION DISABILITY
0.1/ 100
METRIC RATING
266th/ 347
METRIC RANK
2.0%
VISION DISABILITY
99.2/ 100
METRIC RATING
57th/ 347
METRIC RANK
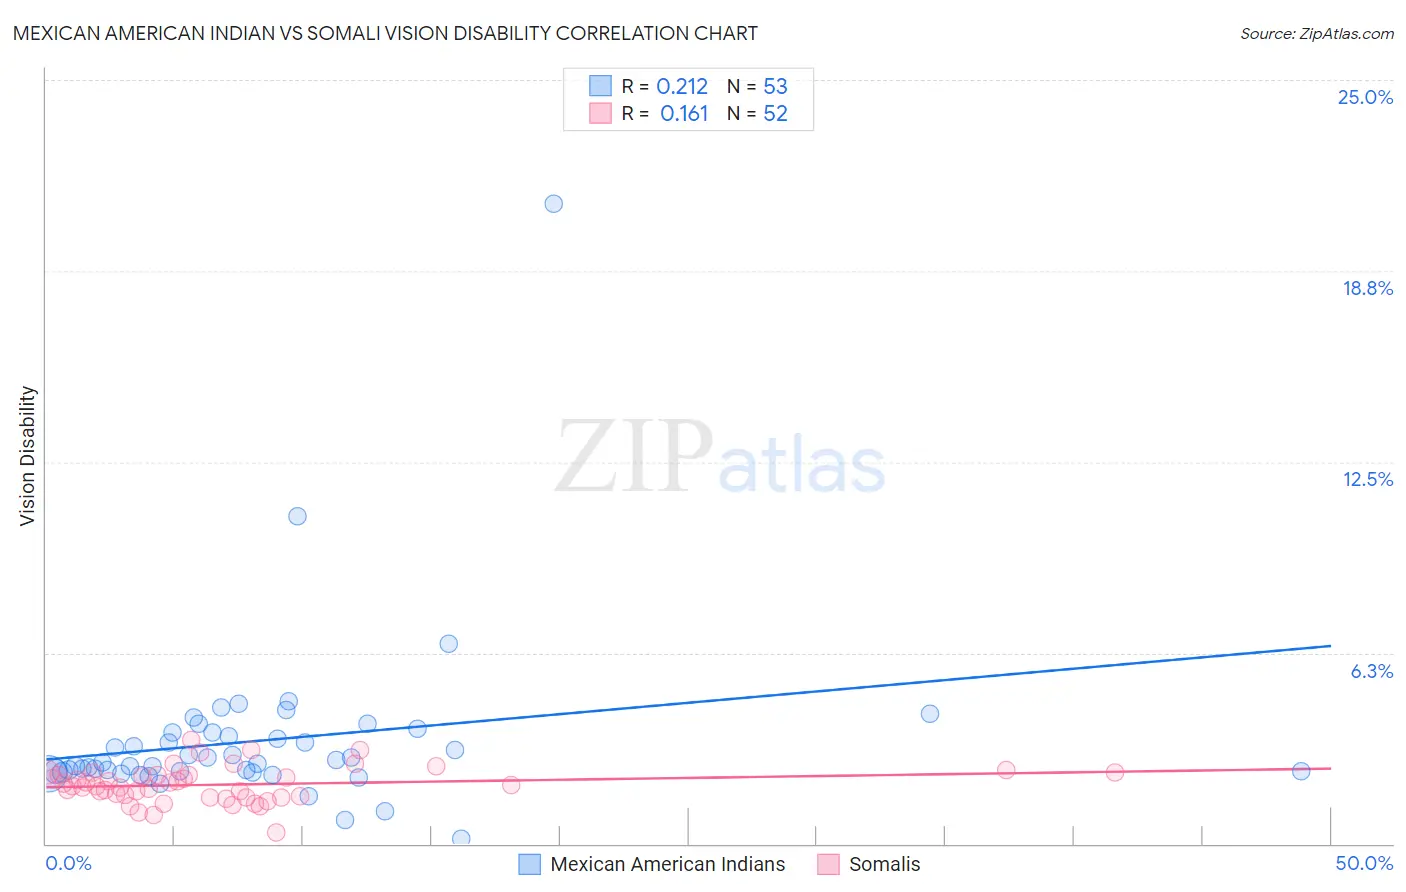
Mexican American Indian vs Somali Vision Disability Correlation Chart
The statistical analysis conducted on geographies consisting of 317,438,641 people shows a weak positive correlation between the proportion of Mexican American Indians and percentage of population with vision disability in the United States with a correlation coefficient (R) of 0.212 and weighted average of 2.4%. Similarly, the statistical analysis conducted on geographies consisting of 99,264,123 people shows a poor positive correlation between the proportion of Somalis and percentage of population with vision disability in the United States with a correlation coefficient (R) of 0.161 and weighted average of 2.0%, a difference of 19.9%.
Vision Disability Correlation Summary
| Measurement | Mexican American Indian | Somali |
| Minimum | 0.16% | 0.35% |
| Maximum | 20.9% | 3.4% |
| Range | 20.8% | 3.0% |
| Mean | 3.4% | 1.9% |
| Median | 2.7% | 1.9% |
| Interquartile 25% (IQ1) | 2.4% | 1.5% |
| Interquartile 75% (IQ3) | 3.6% | 2.3% |
| Interquartile Range (IQR) | 1.3% | 0.72% |
| Standard Deviation (Sample) | 2.9% | 0.58% |
| Standard Deviation (Population) | 2.8% | 0.57% |
Similar Demographics by Vision Disability
Demographics Similar to Mexican American Indians by Vision Disability
In terms of vision disability, the demographic groups most similar to Mexican American Indians are Ute (2.4%, a difference of 0.010%), Immigrants from Jamaica (2.4%, a difference of 0.040%), Immigrants from Liberia (2.4%, a difference of 0.070%), Senegalese (2.4%, a difference of 0.10%), and Immigrants from Belize (2.4%, a difference of 0.19%).
| Demographics | Rating | Rank | Vision Disability |
| Whites/Caucasians | 0.2 /100 | #259 | Tragic 2.4% |
| Belizeans | 0.2 /100 | #260 | Tragic 2.4% |
| Fijians | 0.1 /100 | #261 | Tragic 2.4% |
| Jamaicans | 0.1 /100 | #262 | Tragic 2.4% |
| Immigrants | Belize | 0.1 /100 | #263 | Tragic 2.4% |
| Immigrants | Liberia | 0.1 /100 | #264 | Tragic 2.4% |
| Immigrants | Jamaica | 0.1 /100 | #265 | Tragic 2.4% |
| Mexican American Indians | 0.1 /100 | #266 | Tragic 2.4% |
| Ute | 0.1 /100 | #267 | Tragic 2.4% |
| Senegalese | 0.1 /100 | #268 | Tragic 2.4% |
| Celtics | 0.1 /100 | #269 | Tragic 2.4% |
| Cubans | 0.1 /100 | #270 | Tragic 2.4% |
| Immigrants | Azores | 0.1 /100 | #271 | Tragic 2.4% |
| Spaniards | 0.1 /100 | #272 | Tragic 2.4% |
| Immigrants | Bahamas | 0.1 /100 | #273 | Tragic 2.4% |
Demographics Similar to Somalis by Vision Disability
In terms of vision disability, the demographic groups most similar to Somalis are Jordanian (2.0%, a difference of 0.020%), Immigrants from Saudi Arabia (2.0%, a difference of 0.070%), Laotian (2.0%, a difference of 0.19%), Argentinean (2.0%, a difference of 0.21%), and Macedonian (2.0%, a difference of 0.24%).
| Demographics | Rating | Rank | Vision Disability |
| Afghans | 99.5 /100 | #50 | Exceptional 2.0% |
| Tongans | 99.5 /100 | #51 | Exceptional 2.0% |
| Immigrants | Serbia | 99.4 /100 | #52 | Exceptional 2.0% |
| Immigrants | Belarus | 99.3 /100 | #53 | Exceptional 2.0% |
| Macedonians | 99.3 /100 | #54 | Exceptional 2.0% |
| Laotians | 99.3 /100 | #55 | Exceptional 2.0% |
| Jordanians | 99.2 /100 | #56 | Exceptional 2.0% |
| Somalis | 99.2 /100 | #57 | Exceptional 2.0% |
| Immigrants | Saudi Arabia | 99.2 /100 | #58 | Exceptional 2.0% |
| Argentineans | 99.1 /100 | #59 | Exceptional 2.0% |
| Immigrants | Romania | 99.1 /100 | #60 | Exceptional 2.0% |
| Immigrants | Belgium | 99.1 /100 | #61 | Exceptional 2.0% |
| Immigrants | Russia | 99.1 /100 | #62 | Exceptional 2.0% |
| Armenians | 99.0 /100 | #63 | Exceptional 2.0% |
| Immigrants | Greece | 99.0 /100 | #64 | Exceptional 2.0% |