Paiute vs Immigrants from Peru Female Disability
COMPARE
Paiute
Immigrants from Peru
Female Disability
Female Disability Comparison
Paiute
Immigrants from Peru
14.0%
FEMALE DISABILITY
0.0/ 100
METRIC RATING
318th/ 347
METRIC RANK
11.3%
FEMALE DISABILITY
99.9/ 100
METRIC RATING
52nd/ 347
METRIC RANK
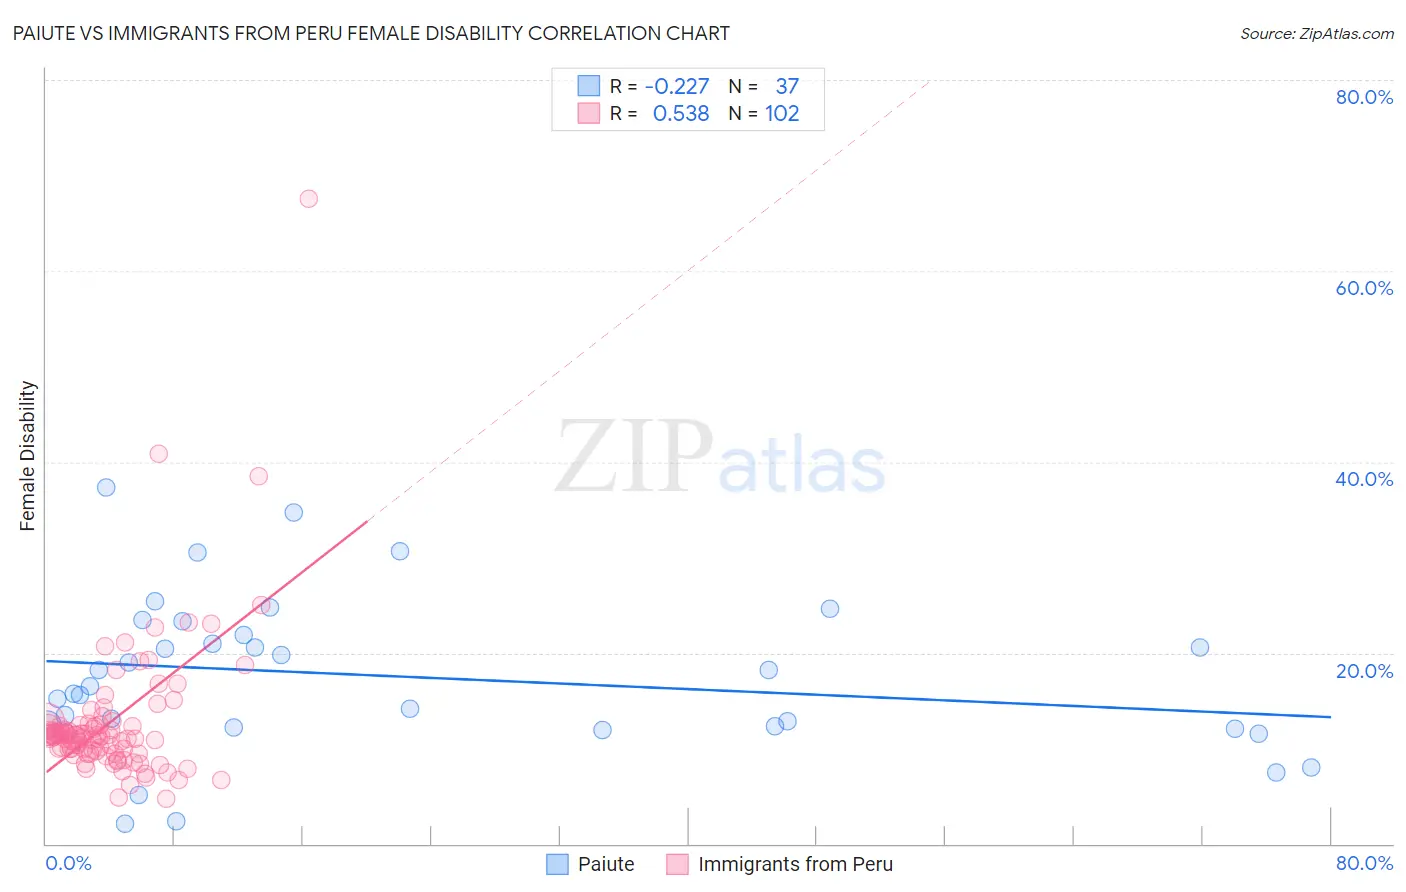
Paiute vs Immigrants from Peru Female Disability Correlation Chart
The statistical analysis conducted on geographies consisting of 58,394,614 people shows a weak negative correlation between the proportion of Paiute and percentage of females with a disability in the United States with a correlation coefficient (R) of -0.227 and weighted average of 14.0%. Similarly, the statistical analysis conducted on geographies consisting of 328,825,833 people shows a substantial positive correlation between the proportion of Immigrants from Peru and percentage of females with a disability in the United States with a correlation coefficient (R) of 0.538 and weighted average of 11.3%, a difference of 23.7%.
Female Disability Correlation Summary
| Measurement | Paiute | Immigrants from Peru |
| Minimum | 2.1% | 4.7% |
| Maximum | 37.3% | 67.6% |
| Range | 35.2% | 62.9% |
| Mean | 17.5% | 12.8% |
| Median | 16.5% | 11.3% |
| Interquartile 25% (IQ1) | 12.2% | 9.6% |
| Interquartile 75% (IQ3) | 22.6% | 12.4% |
| Interquartile Range (IQR) | 10.3% | 2.8% |
| Standard Deviation (Sample) | 8.2% | 7.7% |
| Standard Deviation (Population) | 8.1% | 7.7% |
Similar Demographics by Female Disability
Demographics Similar to Paiute by Female Disability
In terms of female disability, the demographic groups most similar to Paiute are Chippewa (14.0%, a difference of 0.11%), Spanish American (14.0%, a difference of 0.22%), Iroquois (14.0%, a difference of 0.29%), Alaskan Athabascan (13.9%, a difference of 0.58%), and American (14.1%, a difference of 0.63%).
| Demographics | Rating | Rank | Female Disability |
| Hopi | 0.0 /100 | #311 | Tragic 13.7% |
| Delaware | 0.0 /100 | #312 | Tragic 13.8% |
| Blackfeet | 0.0 /100 | #313 | Tragic 13.8% |
| Puget Sound Salish | 0.0 /100 | #314 | Tragic 13.8% |
| Alaskan Athabascans | 0.0 /100 | #315 | Tragic 13.9% |
| Spanish Americans | 0.0 /100 | #316 | Tragic 14.0% |
| Chippewa | 0.0 /100 | #317 | Tragic 14.0% |
| Paiute | 0.0 /100 | #318 | Tragic 14.0% |
| Iroquois | 0.0 /100 | #319 | Tragic 14.0% |
| Americans | 0.0 /100 | #320 | Tragic 14.1% |
| Potawatomi | 0.0 /100 | #321 | Tragic 14.1% |
| Pueblo | 0.0 /100 | #322 | Tragic 14.1% |
| Blacks/African Americans | 0.0 /100 | #323 | Tragic 14.1% |
| Natives/Alaskans | 0.0 /100 | #324 | Tragic 14.1% |
| Navajo | 0.0 /100 | #325 | Tragic 14.2% |
Demographics Similar to Immigrants from Peru by Female Disability
In terms of female disability, the demographic groups most similar to Immigrants from Peru are Immigrants from Saudi Arabia (11.3%, a difference of 0.040%), Peruvian (11.3%, a difference of 0.10%), Immigrants from Belgium (11.3%, a difference of 0.12%), Bulgarian (11.3%, a difference of 0.12%), and Inupiat (11.3%, a difference of 0.20%).
| Demographics | Rating | Rank | Female Disability |
| Immigrants | Sweden | 100.0 /100 | #45 | Exceptional 11.3% |
| Immigrants | Nepal | 100.0 /100 | #46 | Exceptional 11.3% |
| Jordanians | 100.0 /100 | #47 | Exceptional 11.3% |
| Zimbabweans | 100.0 /100 | #48 | Exceptional 11.3% |
| Tongans | 100.0 /100 | #49 | Exceptional 11.3% |
| Inupiat | 100.0 /100 | #50 | Exceptional 11.3% |
| Immigrants | Belgium | 100.0 /100 | #51 | Exceptional 11.3% |
| Immigrants | Peru | 99.9 /100 | #52 | Exceptional 11.3% |
| Immigrants | Saudi Arabia | 99.9 /100 | #53 | Exceptional 11.3% |
| Peruvians | 99.9 /100 | #54 | Exceptional 11.3% |
| Bulgarians | 99.9 /100 | #55 | Exceptional 11.3% |
| Taiwanese | 99.9 /100 | #56 | Exceptional 11.4% |
| South Americans | 99.9 /100 | #57 | Exceptional 11.4% |
| Laotians | 99.9 /100 | #58 | Exceptional 11.4% |
| Immigrants | Spain | 99.9 /100 | #59 | Exceptional 11.4% |