Paiute vs Guyanese Female Disability
COMPARE
Paiute
Guyanese
Female Disability
Female Disability Comparison
Paiute
Guyanese
14.0%
FEMALE DISABILITY
0.0/ 100
METRIC RATING
318th/ 347
METRIC RANK
12.1%
FEMALE DISABILITY
64.7/ 100
METRIC RATING
161st/ 347
METRIC RANK
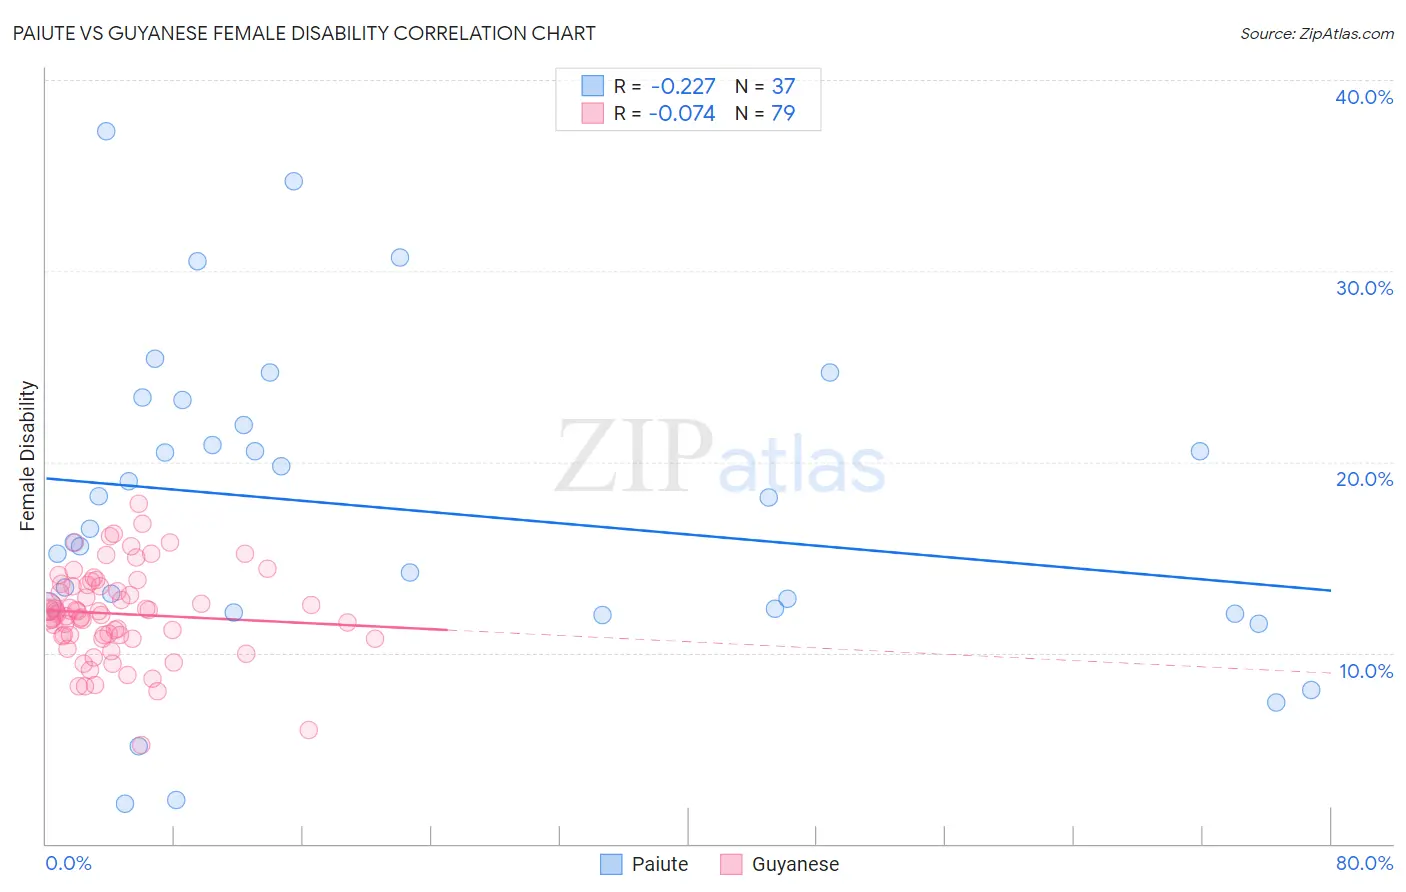
Paiute vs Guyanese Female Disability Correlation Chart
The statistical analysis conducted on geographies consisting of 58,394,614 people shows a weak negative correlation between the proportion of Paiute and percentage of females with a disability in the United States with a correlation coefficient (R) of -0.227 and weighted average of 14.0%. Similarly, the statistical analysis conducted on geographies consisting of 176,903,596 people shows a slight negative correlation between the proportion of Guyanese and percentage of females with a disability in the United States with a correlation coefficient (R) of -0.074 and weighted average of 12.1%, a difference of 15.5%.
Female Disability Correlation Summary
| Measurement | Paiute | Guyanese |
| Minimum | 2.1% | 5.2% |
| Maximum | 37.3% | 17.8% |
| Range | 35.2% | 12.6% |
| Mean | 17.5% | 12.0% |
| Median | 16.5% | 12.2% |
| Interquartile 25% (IQ1) | 12.2% | 10.8% |
| Interquartile 75% (IQ3) | 22.6% | 13.5% |
| Interquartile Range (IQR) | 10.3% | 2.7% |
| Standard Deviation (Sample) | 8.2% | 2.4% |
| Standard Deviation (Population) | 8.1% | 2.4% |
Similar Demographics by Female Disability
Demographics Similar to Paiute by Female Disability
In terms of female disability, the demographic groups most similar to Paiute are Chippewa (14.0%, a difference of 0.11%), Spanish American (14.0%, a difference of 0.22%), Iroquois (14.0%, a difference of 0.29%), Alaskan Athabascan (13.9%, a difference of 0.58%), and American (14.1%, a difference of 0.63%).
| Demographics | Rating | Rank | Female Disability |
| Hopi | 0.0 /100 | #311 | Tragic 13.7% |
| Delaware | 0.0 /100 | #312 | Tragic 13.8% |
| Blackfeet | 0.0 /100 | #313 | Tragic 13.8% |
| Puget Sound Salish | 0.0 /100 | #314 | Tragic 13.8% |
| Alaskan Athabascans | 0.0 /100 | #315 | Tragic 13.9% |
| Spanish Americans | 0.0 /100 | #316 | Tragic 14.0% |
| Chippewa | 0.0 /100 | #317 | Tragic 14.0% |
| Paiute | 0.0 /100 | #318 | Tragic 14.0% |
| Iroquois | 0.0 /100 | #319 | Tragic 14.0% |
| Americans | 0.0 /100 | #320 | Tragic 14.1% |
| Potawatomi | 0.0 /100 | #321 | Tragic 14.1% |
| Pueblo | 0.0 /100 | #322 | Tragic 14.1% |
| Blacks/African Americans | 0.0 /100 | #323 | Tragic 14.1% |
| Natives/Alaskans | 0.0 /100 | #324 | Tragic 14.1% |
| Navajo | 0.0 /100 | #325 | Tragic 14.2% |
Demographics Similar to Guyanese by Female Disability
In terms of female disability, the demographic groups most similar to Guyanese are Immigrants from Ukraine (12.1%, a difference of 0.010%), Guatemalan (12.1%, a difference of 0.030%), Czech (12.1%, a difference of 0.040%), Immigrants from Guatemala (12.1%, a difference of 0.060%), and Immigrants from Oceania (12.1%, a difference of 0.11%).
| Demographics | Rating | Rank | Female Disability |
| Syrians | 76.9 /100 | #154 | Good 12.1% |
| Ghanaians | 76.6 /100 | #155 | Good 12.1% |
| Moroccans | 72.9 /100 | #156 | Good 12.1% |
| Danes | 72.5 /100 | #157 | Good 12.1% |
| Immigrants | Middle Africa | 72.4 /100 | #158 | Good 12.1% |
| Immigrants | Central America | 67.7 /100 | #159 | Good 12.1% |
| Immigrants | Guatemala | 66.0 /100 | #160 | Good 12.1% |
| Guyanese | 64.7 /100 | #161 | Good 12.1% |
| Immigrants | Ukraine | 64.3 /100 | #162 | Good 12.1% |
| Guatemalans | 63.8 /100 | #163 | Good 12.1% |
| Czechs | 63.6 /100 | #164 | Good 12.1% |
| Immigrants | Oceania | 61.8 /100 | #165 | Good 12.1% |
| Lithuanians | 59.5 /100 | #166 | Average 12.2% |
| Immigrants | Latin America | 59.0 /100 | #167 | Average 12.2% |
| Immigrants | Haiti | 58.8 /100 | #168 | Average 12.2% |