Paiute vs Immigrants from Peru Bachelor's Degree
COMPARE
Paiute
Immigrants from Peru
Bachelor's Degree
Bachelor's Degree Comparison
Paiute
Immigrants from Peru
28.1%
BACHELOR'S DEGREE
0.0/ 100
METRIC RATING
327th/ 347
METRIC RANK
37.5%
BACHELOR'S DEGREE
41.3/ 100
METRIC RATING
185th/ 347
METRIC RANK
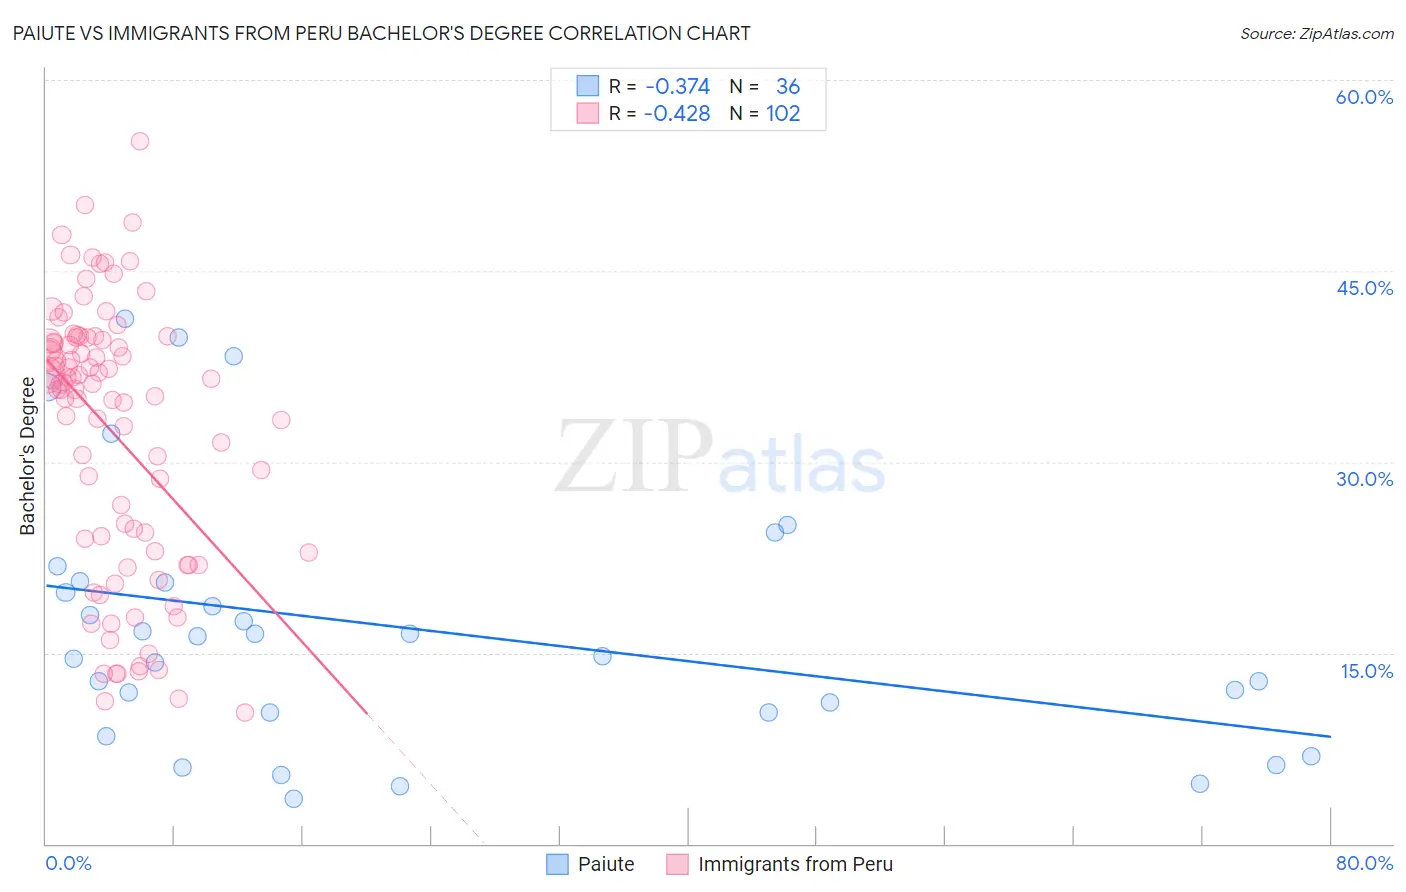
Paiute vs Immigrants from Peru Bachelor's Degree Correlation Chart
The statistical analysis conducted on geographies consisting of 58,403,088 people shows a mild negative correlation between the proportion of Paiute and percentage of population with at least bachelor's degree education in the United States with a correlation coefficient (R) of -0.374 and weighted average of 28.1%. Similarly, the statistical analysis conducted on geographies consisting of 328,855,740 people shows a moderate negative correlation between the proportion of Immigrants from Peru and percentage of population with at least bachelor's degree education in the United States with a correlation coefficient (R) of -0.428 and weighted average of 37.5%, a difference of 33.5%.
Bachelor's Degree Correlation Summary
| Measurement | Paiute | Immigrants from Peru |
| Minimum | 3.5% | 10.3% |
| Maximum | 41.3% | 55.2% |
| Range | 37.8% | 44.9% |
| Mean | 16.9% | 32.4% |
| Median | 15.5% | 36.1% |
| Interquartile 25% (IQ1) | 10.3% | 23.0% |
| Interquartile 75% (IQ3) | 20.6% | 39.5% |
| Interquartile Range (IQR) | 10.2% | 16.5% |
| Standard Deviation (Sample) | 10.1% | 10.6% |
| Standard Deviation (Population) | 10.0% | 10.5% |
Similar Demographics by Bachelor's Degree
Demographics Similar to Paiute by Bachelor's Degree
In terms of bachelor's degree, the demographic groups most similar to Paiute are Apache (28.3%, a difference of 0.67%), Pennsylvania German (28.4%, a difference of 1.1%), Crow (27.7%, a difference of 1.2%), Dutch West Indian (28.5%, a difference of 1.5%), and Fijian (28.7%, a difference of 2.2%).
| Demographics | Rating | Rank | Bachelor's Degree |
| Kiowa | 0.0 /100 | #320 | Tragic 28.8% |
| Alaskan Athabascans | 0.0 /100 | #321 | Tragic 28.8% |
| Tsimshian | 0.0 /100 | #322 | Tragic 28.8% |
| Fijians | 0.0 /100 | #323 | Tragic 28.7% |
| Dutch West Indians | 0.0 /100 | #324 | Tragic 28.5% |
| Pennsylvania Germans | 0.0 /100 | #325 | Tragic 28.4% |
| Apache | 0.0 /100 | #326 | Tragic 28.3% |
| Paiute | 0.0 /100 | #327 | Tragic 28.1% |
| Crow | 0.0 /100 | #328 | Tragic 27.7% |
| Immigrants | Central America | 0.0 /100 | #329 | Tragic 27.5% |
| Spanish American Indians | 0.0 /100 | #330 | Tragic 27.5% |
| Immigrants | Azores | 0.0 /100 | #331 | Tragic 27.3% |
| Menominee | 0.0 /100 | #332 | Tragic 27.3% |
| Mexicans | 0.0 /100 | #333 | Tragic 27.1% |
| Arapaho | 0.0 /100 | #334 | Tragic 26.6% |
Demographics Similar to Immigrants from Peru by Bachelor's Degree
In terms of bachelor's degree, the demographic groups most similar to Immigrants from Peru are Scandinavian (37.5%, a difference of 0.040%), Senegalese (37.5%, a difference of 0.080%), Norwegian (37.5%, a difference of 0.10%), English (37.4%, a difference of 0.17%), and Immigrants from Bosnia and Herzegovina (37.6%, a difference of 0.21%).
| Demographics | Rating | Rank | Bachelor's Degree |
| Immigrants | Cameroon | 46.8 /100 | #178 | Average 37.7% |
| Immigrants | Colombia | 45.4 /100 | #179 | Average 37.7% |
| Irish | 44.3 /100 | #180 | Average 37.6% |
| Immigrants | Senegal | 43.8 /100 | #181 | Average 37.6% |
| Immigrants | Bosnia and Herzegovina | 43.4 /100 | #182 | Average 37.6% |
| Senegalese | 42.2 /100 | #183 | Average 37.5% |
| Scandinavians | 41.7 /100 | #184 | Average 37.5% |
| Immigrants | Peru | 41.3 /100 | #185 | Average 37.5% |
| Norwegians | 40.4 /100 | #186 | Average 37.5% |
| English | 39.7 /100 | #187 | Fair 37.4% |
| Immigrants | Oceania | 37.3 /100 | #188 | Fair 37.3% |
| Slovaks | 36.9 /100 | #189 | Fair 37.3% |
| Swiss | 34.1 /100 | #190 | Fair 37.2% |
| Nigerians | 33.9 /100 | #191 | Fair 37.2% |
| Immigrants | Vietnam | 32.1 /100 | #192 | Fair 37.1% |