Yuman vs Immigrants from Peru Female Disability
COMPARE
Yuman
Immigrants from Peru
Female Disability
Female Disability Comparison
Yuman
Immigrants from Peru
14.5%
FEMALE DISABILITY
0.0/ 100
METRIC RATING
330th/ 347
METRIC RANK
11.3%
FEMALE DISABILITY
99.9/ 100
METRIC RATING
52nd/ 347
METRIC RANK
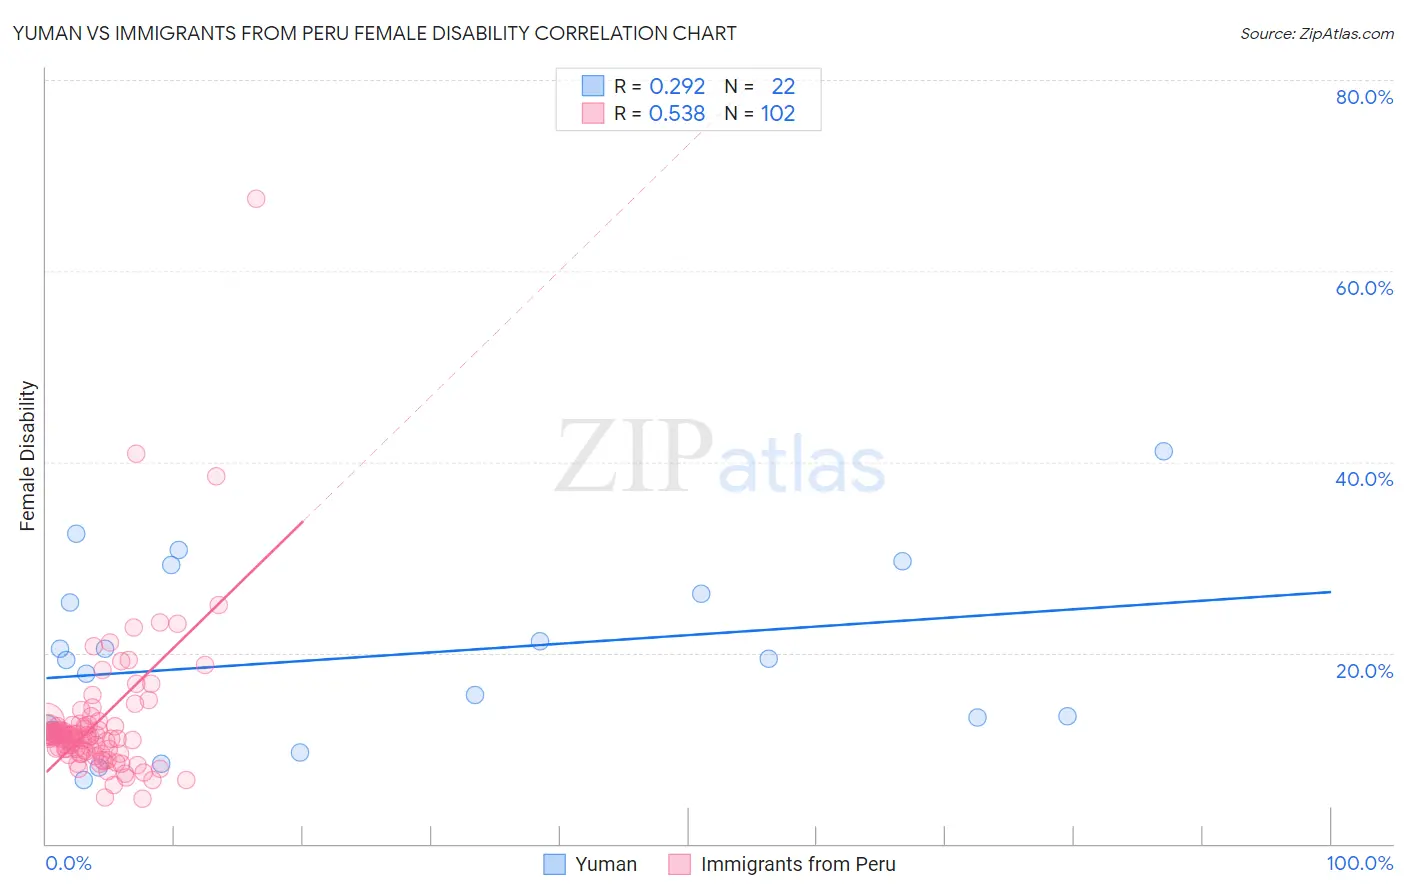
Yuman vs Immigrants from Peru Female Disability Correlation Chart
The statistical analysis conducted on geographies consisting of 40,663,029 people shows a weak positive correlation between the proportion of Yuman and percentage of females with a disability in the United States with a correlation coefficient (R) of 0.292 and weighted average of 14.5%. Similarly, the statistical analysis conducted on geographies consisting of 328,825,833 people shows a substantial positive correlation between the proportion of Immigrants from Peru and percentage of females with a disability in the United States with a correlation coefficient (R) of 0.538 and weighted average of 11.3%, a difference of 28.1%.
Female Disability Correlation Summary
| Measurement | Yuman | Immigrants from Peru |
| Minimum | 6.6% | 4.7% |
| Maximum | 41.2% | 67.6% |
| Range | 34.6% | 62.9% |
| Mean | 19.6% | 12.8% |
| Median | 19.4% | 11.3% |
| Interquartile 25% (IQ1) | 12.1% | 9.6% |
| Interquartile 75% (IQ3) | 26.2% | 12.4% |
| Interquartile Range (IQR) | 14.0% | 2.8% |
| Standard Deviation (Sample) | 9.2% | 7.7% |
| Standard Deviation (Population) | 9.0% | 7.7% |
Similar Demographics by Female Disability
Demographics Similar to Yuman by Female Disability
In terms of female disability, the demographic groups most similar to Yuman are Immigrants from Cabo Verde (14.6%, a difference of 0.42%), Osage (14.3%, a difference of 1.4%), Ottawa (14.2%, a difference of 1.8%), Cape Verdean (14.2%, a difference of 1.8%), and Pima (14.8%, a difference of 2.0%).
| Demographics | Rating | Rank | Female Disability |
| Blacks/African Americans | 0.0 /100 | #323 | Tragic 14.1% |
| Natives/Alaskans | 0.0 /100 | #324 | Tragic 14.1% |
| Navajo | 0.0 /100 | #325 | Tragic 14.2% |
| Comanche | 0.0 /100 | #326 | Tragic 14.2% |
| Ottawa | 0.0 /100 | #327 | Tragic 14.2% |
| Cape Verdeans | 0.0 /100 | #328 | Tragic 14.2% |
| Osage | 0.0 /100 | #329 | Tragic 14.3% |
| Yuman | 0.0 /100 | #330 | Tragic 14.5% |
| Immigrants | Cabo Verde | 0.0 /100 | #331 | Tragic 14.6% |
| Pima | 0.0 /100 | #332 | Tragic 14.8% |
| Immigrants | Azores | 0.0 /100 | #333 | Tragic 14.9% |
| Cherokee | 0.0 /100 | #334 | Tragic 14.9% |
| Cajuns | 0.0 /100 | #335 | Tragic 14.9% |
| Seminole | 0.0 /100 | #336 | Tragic 15.0% |
| Tohono O'odham | 0.0 /100 | #337 | Tragic 15.0% |
Demographics Similar to Immigrants from Peru by Female Disability
In terms of female disability, the demographic groups most similar to Immigrants from Peru are Immigrants from Saudi Arabia (11.3%, a difference of 0.040%), Peruvian (11.3%, a difference of 0.10%), Immigrants from Belgium (11.3%, a difference of 0.12%), Bulgarian (11.3%, a difference of 0.12%), and Inupiat (11.3%, a difference of 0.20%).
| Demographics | Rating | Rank | Female Disability |
| Immigrants | Sweden | 100.0 /100 | #45 | Exceptional 11.3% |
| Immigrants | Nepal | 100.0 /100 | #46 | Exceptional 11.3% |
| Jordanians | 100.0 /100 | #47 | Exceptional 11.3% |
| Zimbabweans | 100.0 /100 | #48 | Exceptional 11.3% |
| Tongans | 100.0 /100 | #49 | Exceptional 11.3% |
| Inupiat | 100.0 /100 | #50 | Exceptional 11.3% |
| Immigrants | Belgium | 100.0 /100 | #51 | Exceptional 11.3% |
| Immigrants | Peru | 99.9 /100 | #52 | Exceptional 11.3% |
| Immigrants | Saudi Arabia | 99.9 /100 | #53 | Exceptional 11.3% |
| Peruvians | 99.9 /100 | #54 | Exceptional 11.3% |
| Bulgarians | 99.9 /100 | #55 | Exceptional 11.3% |
| Taiwanese | 99.9 /100 | #56 | Exceptional 11.4% |
| South Americans | 99.9 /100 | #57 | Exceptional 11.4% |
| Laotians | 99.9 /100 | #58 | Exceptional 11.4% |
| Immigrants | Spain | 99.9 /100 | #59 | Exceptional 11.4% |