Paiute vs Immigrants from Mexico Poverty
COMPARE
Paiute
Immigrants from Mexico
Poverty
Poverty Comparison
Paiute
Immigrants from Mexico
16.7%
POVERTY
0.0/ 100
METRIC RATING
326th/ 347
METRIC RANK
15.5%
POVERTY
0.0/ 100
METRIC RATING
304th/ 347
METRIC RANK
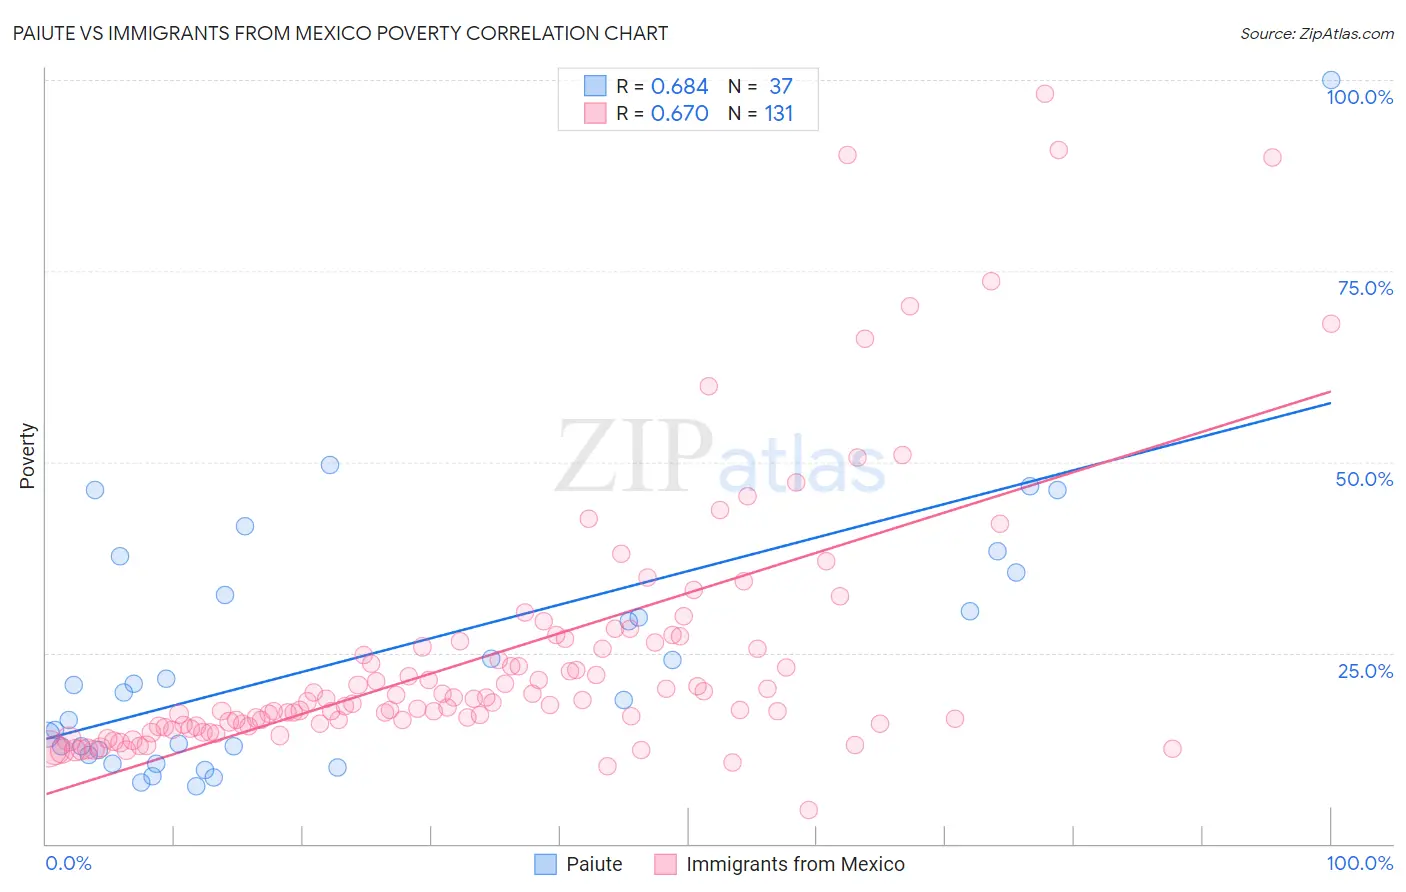
Paiute vs Immigrants from Mexico Poverty Correlation Chart
The statistical analysis conducted on geographies consisting of 58,392,154 people shows a significant positive correlation between the proportion of Paiute and poverty level in the United States with a correlation coefficient (R) of 0.684 and weighted average of 16.7%. Similarly, the statistical analysis conducted on geographies consisting of 513,374,473 people shows a significant positive correlation between the proportion of Immigrants from Mexico and poverty level in the United States with a correlation coefficient (R) of 0.670 and weighted average of 15.5%, a difference of 8.0%.
Poverty Correlation Summary
| Measurement | Paiute | Immigrants from Mexico |
| Minimum | 7.5% | 4.4% |
| Maximum | 100.0% | 98.2% |
| Range | 92.5% | 93.8% |
| Mean | 24.5% | 24.6% |
| Median | 19.8% | 18.5% |
| Interquartile 25% (IQ1) | 11.9% | 15.4% |
| Interquartile 75% (IQ3) | 34.1% | 26.4% |
| Interquartile Range (IQR) | 22.1% | 11.0% |
| Standard Deviation (Sample) | 18.1% | 17.3% |
| Standard Deviation (Population) | 17.9% | 17.2% |
Similar Demographics by Poverty
Demographics Similar to Paiute by Poverty
In terms of poverty, the demographic groups most similar to Paiute are Central American Indian (16.7%, a difference of 0.29%), Yakama (16.7%, a difference of 0.52%), Kiowa (16.8%, a difference of 0.53%), Ute (16.9%, a difference of 0.96%), and Colville (16.6%, a difference of 1.1%).
| Demographics | Rating | Rank | Poverty |
| Immigrants | Congo | 0.0 /100 | #319 | Tragic 16.1% |
| Immigrants | Honduras | 0.0 /100 | #320 | Tragic 16.2% |
| Arapaho | 0.0 /100 | #321 | Tragic 16.3% |
| Menominee | 0.0 /100 | #322 | Tragic 16.4% |
| Colville | 0.0 /100 | #323 | Tragic 16.6% |
| Yakama | 0.0 /100 | #324 | Tragic 16.7% |
| Central American Indians | 0.0 /100 | #325 | Tragic 16.7% |
| Paiute | 0.0 /100 | #326 | Tragic 16.7% |
| Kiowa | 0.0 /100 | #327 | Tragic 16.8% |
| Ute | 0.0 /100 | #328 | Tragic 16.9% |
| Blacks/African Americans | 0.0 /100 | #329 | Tragic 17.3% |
| Dominicans | 0.0 /100 | #330 | Tragic 17.6% |
| Immigrants | Dominican Republic | 0.0 /100 | #331 | Tragic 17.8% |
| Natives/Alaskans | 0.0 /100 | #332 | Tragic 18.1% |
| Houma | 0.0 /100 | #333 | Tragic 18.4% |
Demographics Similar to Immigrants from Mexico by Poverty
In terms of poverty, the demographic groups most similar to Immigrants from Mexico are Immigrants from Guatemala (15.5%, a difference of 0.030%), Immigrants from Caribbean (15.5%, a difference of 0.090%), Creek (15.6%, a difference of 0.47%), African (15.6%, a difference of 0.54%), and Somali (15.4%, a difference of 0.57%).
| Demographics | Rating | Rank | Poverty |
| Immigrants | Bangladesh | 0.0 /100 | #297 | Tragic 15.3% |
| Immigrants | Senegal | 0.0 /100 | #298 | Tragic 15.3% |
| Senegalese | 0.0 /100 | #299 | Tragic 15.3% |
| Immigrants | Central America | 0.0 /100 | #300 | Tragic 15.4% |
| Bahamians | 0.0 /100 | #301 | Tragic 15.4% |
| Somalis | 0.0 /100 | #302 | Tragic 15.4% |
| Immigrants | Caribbean | 0.0 /100 | #303 | Tragic 15.5% |
| Immigrants | Mexico | 0.0 /100 | #304 | Tragic 15.5% |
| Immigrants | Guatemala | 0.0 /100 | #305 | Tragic 15.5% |
| Creek | 0.0 /100 | #306 | Tragic 15.6% |
| Africans | 0.0 /100 | #307 | Tragic 15.6% |
| Choctaw | 0.0 /100 | #308 | Tragic 15.6% |
| Seminole | 0.0 /100 | #309 | Tragic 15.6% |
| Dutch West Indians | 0.0 /100 | #310 | Tragic 15.6% |
| Chippewa | 0.0 /100 | #311 | Tragic 15.7% |