Osage vs Estonian Disability Age 18 to 34
COMPARE
Osage
Estonian
Disability Age 18 to 34
Disability Age 18 to 34 Comparison
Osage
Estonians
8.3%
DISABILITY AGE 18 TO 34
0.0/ 100
METRIC RATING
330th/ 347
METRIC RANK
6.8%
DISABILITY AGE 18 TO 34
20.6/ 100
METRIC RATING
197th/ 347
METRIC RANK
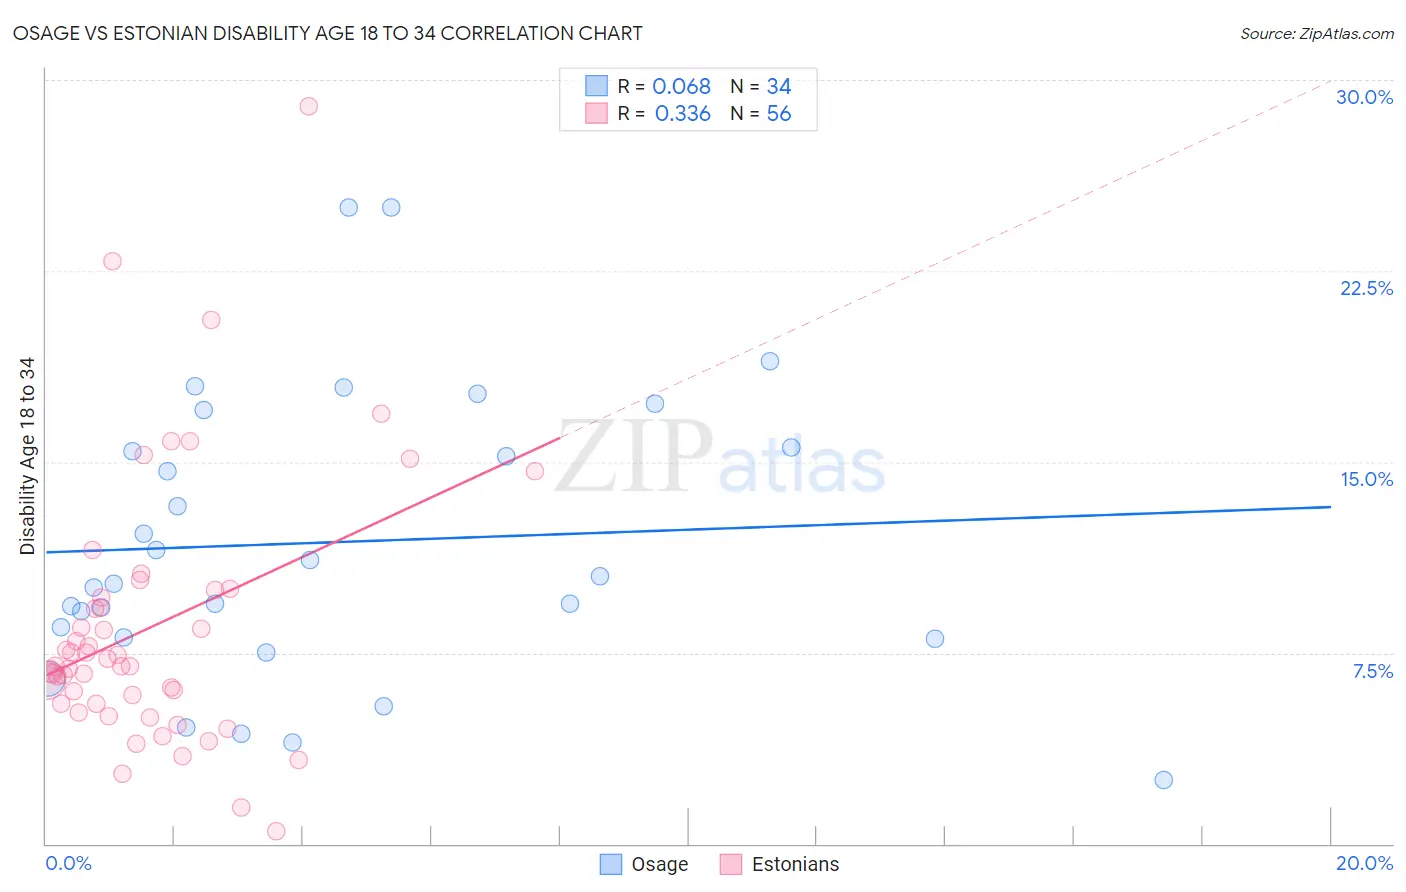
Osage vs Estonian Disability Age 18 to 34 Correlation Chart
The statistical analysis conducted on geographies consisting of 91,736,463 people shows a slight positive correlation between the proportion of Osage and percentage of population with a disability between the ages 18 and 35 in the United States with a correlation coefficient (R) of 0.068 and weighted average of 8.3%. Similarly, the statistical analysis conducted on geographies consisting of 123,466,484 people shows a mild positive correlation between the proportion of Estonians and percentage of population with a disability between the ages 18 and 35 in the United States with a correlation coefficient (R) of 0.336 and weighted average of 6.8%, a difference of 22.8%.
Disability Age 18 to 34 Correlation Summary
| Measurement | Osage | Estonian |
| Minimum | 2.5% | 0.51% |
| Maximum | 25.0% | 28.9% |
| Range | 22.5% | 28.4% |
| Mean | 11.8% | 8.5% |
| Median | 10.4% | 7.0% |
| Interquartile 25% (IQ1) | 8.1% | 5.5% |
| Interquartile 75% (IQ3) | 15.6% | 9.8% |
| Interquartile Range (IQR) | 7.4% | 4.3% |
| Standard Deviation (Sample) | 5.6% | 5.2% |
| Standard Deviation (Population) | 5.5% | 5.2% |
Similar Demographics by Disability Age 18 to 34
Demographics Similar to Osage by Disability Age 18 to 34
In terms of disability age 18 to 34, the demographic groups most similar to Osage are Comanche (8.3%, a difference of 0.18%), Crow (8.3%, a difference of 0.25%), Puget Sound Salish (8.3%, a difference of 0.40%), Delaware (8.2%, a difference of 0.78%), and Sioux (8.2%, a difference of 0.82%).
| Demographics | Rating | Rank | Disability Age 18 to 34 |
| French American Indians | 0.0 /100 | #323 | Tragic 8.2% |
| Cajuns | 0.0 /100 | #324 | Tragic 8.2% |
| Natives/Alaskans | 0.0 /100 | #325 | Tragic 8.2% |
| Potawatomi | 0.0 /100 | #326 | Tragic 8.2% |
| Sioux | 0.0 /100 | #327 | Tragic 8.2% |
| Delaware | 0.0 /100 | #328 | Tragic 8.2% |
| Crow | 0.0 /100 | #329 | Tragic 8.3% |
| Osage | 0.0 /100 | #330 | Tragic 8.3% |
| Comanche | 0.0 /100 | #331 | Tragic 8.3% |
| Puget Sound Salish | 0.0 /100 | #332 | Tragic 8.3% |
| Apache | 0.0 /100 | #333 | Tragic 8.4% |
| Dutch West Indians | 0.0 /100 | #334 | Tragic 8.4% |
| Seminole | 0.0 /100 | #335 | Tragic 8.4% |
| Immigrants | Azores | 0.0 /100 | #336 | Tragic 8.5% |
| Ottawa | 0.0 /100 | #337 | Tragic 8.6% |
Demographics Similar to Estonians by Disability Age 18 to 34
In terms of disability age 18 to 34, the demographic groups most similar to Estonians are Immigrants from Netherlands (6.7%, a difference of 0.040%), Australian (6.8%, a difference of 0.13%), Mexican American Indian (6.7%, a difference of 0.17%), Kenyan (6.8%, a difference of 0.25%), and Sierra Leonean (6.8%, a difference of 0.34%).
| Demographics | Rating | Rank | Disability Age 18 to 34 |
| Immigrants | Zimbabwe | 33.6 /100 | #190 | Fair 6.7% |
| Immigrants | Eastern Africa | 33.2 /100 | #191 | Fair 6.7% |
| Immigrants | Western Africa | 28.3 /100 | #192 | Fair 6.7% |
| Immigrants | Uganda | 25.1 /100 | #193 | Fair 6.7% |
| Immigrants | Sudan | 24.9 /100 | #194 | Fair 6.7% |
| Mexican American Indians | 22.3 /100 | #195 | Fair 6.7% |
| Immigrants | Netherlands | 21.0 /100 | #196 | Fair 6.7% |
| Estonians | 20.6 /100 | #197 | Fair 6.8% |
| Australians | 19.4 /100 | #198 | Poor 6.8% |
| Kenyans | 18.3 /100 | #199 | Poor 6.8% |
| Sierra Leoneans | 17.5 /100 | #200 | Poor 6.8% |
| Greeks | 16.1 /100 | #201 | Poor 6.8% |
| Panamanians | 15.8 /100 | #202 | Poor 6.8% |
| Hispanics or Latinos | 13.8 /100 | #203 | Poor 6.8% |
| Immigrants | Bosnia and Herzegovina | 13.6 /100 | #204 | Poor 6.8% |