Dutch vs Ute Disability Age 18 to 34
COMPARE
Dutch
Ute
Disability Age 18 to 34
Disability Age 18 to 34 Comparison
Dutch
Ute
7.7%
DISABILITY AGE 18 TO 34
0.0/ 100
METRIC RATING
298th/ 347
METRIC RANK
7.0%
DISABILITY AGE 18 TO 34
3.8/ 100
METRIC RATING
231st/ 347
METRIC RANK
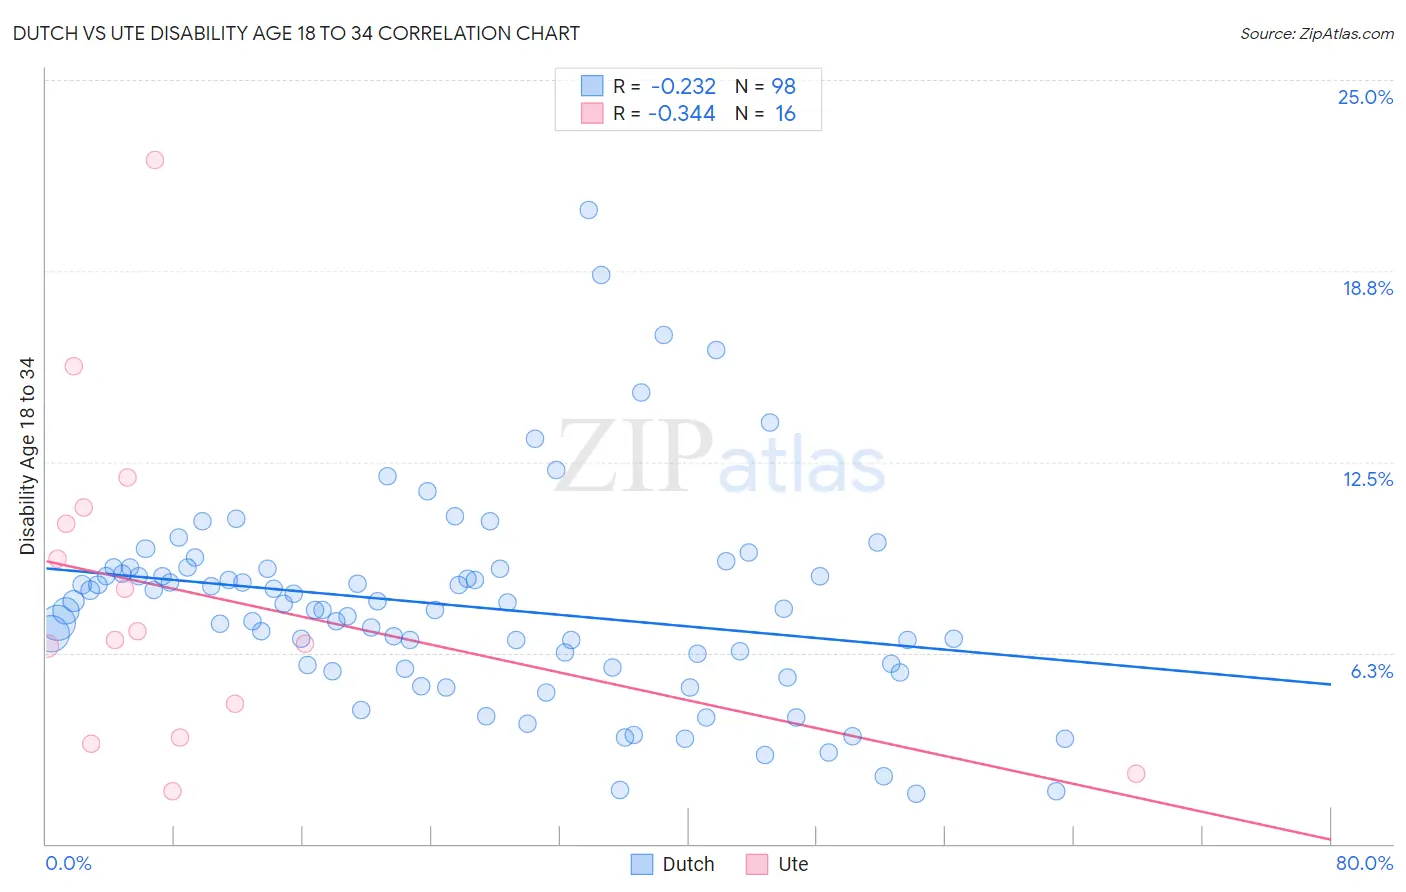
Dutch vs Ute Disability Age 18 to 34 Correlation Chart
The statistical analysis conducted on geographies consisting of 549,561,766 people shows a weak negative correlation between the proportion of Dutch and percentage of population with a disability between the ages 18 and 35 in the United States with a correlation coefficient (R) of -0.232 and weighted average of 7.7%. Similarly, the statistical analysis conducted on geographies consisting of 55,639,467 people shows a mild negative correlation between the proportion of Ute and percentage of population with a disability between the ages 18 and 35 in the United States with a correlation coefficient (R) of -0.344 and weighted average of 7.0%, a difference of 10.7%.
Disability Age 18 to 34 Correlation Summary
| Measurement | Dutch | Ute |
| Minimum | 1.6% | 1.7% |
| Maximum | 20.7% | 22.4% |
| Range | 19.1% | 20.7% |
| Mean | 7.8% | 8.2% |
| Median | 7.7% | 6.8% |
| Interquartile 25% (IQ1) | 5.8% | 4.0% |
| Interquartile 75% (IQ3) | 9.0% | 10.7% |
| Interquartile Range (IQR) | 3.2% | 6.7% |
| Standard Deviation (Sample) | 3.4% | 5.4% |
| Standard Deviation (Population) | 3.3% | 5.2% |
Similar Demographics by Disability Age 18 to 34
Demographics Similar to Dutch by Disability Age 18 to 34
In terms of disability age 18 to 34, the demographic groups most similar to Dutch are Pueblo (7.7%, a difference of 0.080%), Cape Verdean (7.7%, a difference of 0.090%), German (7.7%, a difference of 0.24%), Scottish (7.7%, a difference of 0.25%), and Tlingit-Haida (7.7%, a difference of 0.27%).
| Demographics | Rating | Rank | Disability Age 18 to 34 |
| Irish | 0.0 /100 | #291 | Tragic 7.7% |
| Blacks/African Americans | 0.0 /100 | #292 | Tragic 7.7% |
| Scandinavians | 0.0 /100 | #293 | Tragic 7.7% |
| Immigrants | Cabo Verde | 0.0 /100 | #294 | Tragic 7.7% |
| Tlingit-Haida | 0.0 /100 | #295 | Tragic 7.7% |
| Cape Verdeans | 0.0 /100 | #296 | Tragic 7.7% |
| Pueblo | 0.0 /100 | #297 | Tragic 7.7% |
| Dutch | 0.0 /100 | #298 | Tragic 7.7% |
| Germans | 0.0 /100 | #299 | Tragic 7.7% |
| Scottish | 0.0 /100 | #300 | Tragic 7.7% |
| Pima | 0.0 /100 | #301 | Tragic 7.7% |
| Welsh | 0.0 /100 | #302 | Tragic 7.7% |
| Cheyenne | 0.0 /100 | #303 | Tragic 7.7% |
| Shoshone | 0.0 /100 | #304 | Tragic 7.8% |
| Menominee | 0.0 /100 | #305 | Tragic 7.8% |
Demographics Similar to Ute by Disability Age 18 to 34
In terms of disability age 18 to 34, the demographic groups most similar to Ute are Immigrants from North America (7.0%, a difference of 0.020%), Lithuanian (7.0%, a difference of 0.11%), Immigrants from Yemen (7.0%, a difference of 0.14%), Immigrants from Canada (7.0%, a difference of 0.20%), and Ugandan (6.9%, a difference of 0.25%).
| Demographics | Rating | Rank | Disability Age 18 to 34 |
| Senegalese | 4.9 /100 | #224 | Tragic 6.9% |
| Central American Indians | 4.7 /100 | #225 | Tragic 6.9% |
| Ugandans | 4.4 /100 | #226 | Tragic 6.9% |
| Immigrants | Canada | 4.3 /100 | #227 | Tragic 7.0% |
| Immigrants | Yemen | 4.2 /100 | #228 | Tragic 7.0% |
| Lithuanians | 4.1 /100 | #229 | Tragic 7.0% |
| Immigrants | North America | 3.9 /100 | #230 | Tragic 7.0% |
| Ute | 3.8 /100 | #231 | Tragic 7.0% |
| Samoans | 3.2 /100 | #232 | Tragic 7.0% |
| New Zealanders | 2.7 /100 | #233 | Tragic 7.0% |
| Alsatians | 2.1 /100 | #234 | Tragic 7.0% |
| Sub-Saharan Africans | 1.7 /100 | #235 | Tragic 7.1% |
| Liberians | 1.5 /100 | #236 | Tragic 7.1% |
| Austrians | 1.3 /100 | #237 | Tragic 7.1% |
| Marshallese | 1.3 /100 | #238 | Tragic 7.1% |