Marshallese vs Ute Disability Age 18 to 34
COMPARE
Marshallese
Ute
Disability Age 18 to 34
Disability Age 18 to 34 Comparison
Marshallese
Ute
7.1%
DISABILITY AGE 18 TO 34
1.3/ 100
METRIC RATING
238th/ 347
METRIC RANK
7.0%
DISABILITY AGE 18 TO 34
3.8/ 100
METRIC RATING
231st/ 347
METRIC RANK
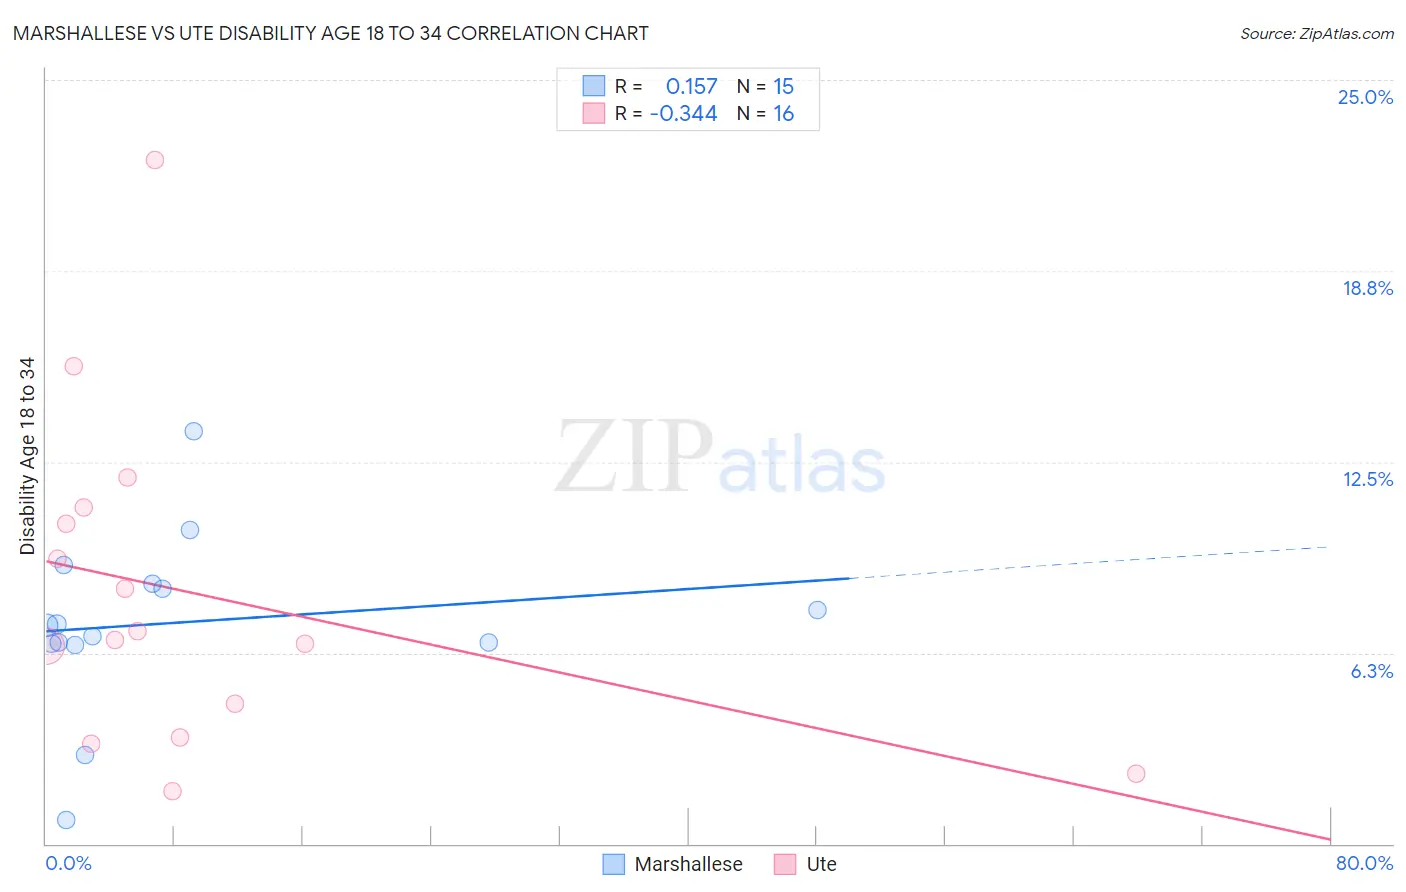
Marshallese vs Ute Disability Age 18 to 34 Correlation Chart
The statistical analysis conducted on geographies consisting of 14,758,434 people shows a poor positive correlation between the proportion of Marshallese and percentage of population with a disability between the ages 18 and 35 in the United States with a correlation coefficient (R) of 0.157 and weighted average of 7.1%. Similarly, the statistical analysis conducted on geographies consisting of 55,639,467 people shows a mild negative correlation between the proportion of Ute and percentage of population with a disability between the ages 18 and 35 in the United States with a correlation coefficient (R) of -0.344 and weighted average of 7.0%, a difference of 1.8%.
Disability Age 18 to 34 Correlation Summary
| Measurement | Marshallese | Ute |
| Minimum | 0.80% | 1.7% |
| Maximum | 13.5% | 22.4% |
| Range | 12.7% | 20.7% |
| Mean | 7.2% | 8.2% |
| Median | 7.1% | 6.8% |
| Interquartile 25% (IQ1) | 6.6% | 4.0% |
| Interquartile 75% (IQ3) | 8.5% | 10.7% |
| Interquartile Range (IQR) | 1.9% | 6.7% |
| Standard Deviation (Sample) | 2.9% | 5.4% |
| Standard Deviation (Population) | 2.8% | 5.2% |
Demographics Similar to Marshallese and Ute by Disability Age 18 to 34
In terms of disability age 18 to 34, the demographic groups most similar to Marshallese are Austrian (7.1%, a difference of 0.050%), Italian (7.1%, a difference of 0.12%), Liberian (7.1%, a difference of 0.22%), Arapaho (7.1%, a difference of 0.23%), and Nepalese (7.1%, a difference of 0.24%). Similarly, the demographic groups most similar to Ute are Immigrants from North America (7.0%, a difference of 0.020%), Lithuanian (7.0%, a difference of 0.11%), Immigrants from Yemen (7.0%, a difference of 0.14%), Immigrants from Canada (7.0%, a difference of 0.20%), and Ugandan (6.9%, a difference of 0.25%).
| Demographics | Rating | Rank | Disability Age 18 to 34 |
| Senegalese | 4.9 /100 | #224 | Tragic 6.9% |
| Central American Indians | 4.7 /100 | #225 | Tragic 6.9% |
| Ugandans | 4.4 /100 | #226 | Tragic 6.9% |
| Immigrants | Canada | 4.3 /100 | #227 | Tragic 7.0% |
| Immigrants | Yemen | 4.2 /100 | #228 | Tragic 7.0% |
| Lithuanians | 4.1 /100 | #229 | Tragic 7.0% |
| Immigrants | North America | 3.9 /100 | #230 | Tragic 7.0% |
| Ute | 3.8 /100 | #231 | Tragic 7.0% |
| Samoans | 3.2 /100 | #232 | Tragic 7.0% |
| New Zealanders | 2.7 /100 | #233 | Tragic 7.0% |
| Alsatians | 2.1 /100 | #234 | Tragic 7.0% |
| Sub-Saharan Africans | 1.7 /100 | #235 | Tragic 7.1% |
| Liberians | 1.5 /100 | #236 | Tragic 7.1% |
| Austrians | 1.3 /100 | #237 | Tragic 7.1% |
| Marshallese | 1.3 /100 | #238 | Tragic 7.1% |
| Italians | 1.2 /100 | #239 | Tragic 7.1% |
| Arapaho | 1.1 /100 | #240 | Tragic 7.1% |
| Nepalese | 1.1 /100 | #241 | Tragic 7.1% |
| Immigrants | Congo | 1.1 /100 | #242 | Tragic 7.1% |
| Icelanders | 1.0 /100 | #243 | Tragic 7.1% |
| Immigrants | Zaire | 0.9 /100 | #244 | Tragic 7.1% |