Yugoslavian vs Immigrants from France Cognitive Disability
COMPARE
Yugoslavian
Immigrants from France
Cognitive Disability
Cognitive Disability Comparison
Yugoslavians
Immigrants from France
17.2%
COGNITIVE DISABILITY
71.6/ 100
METRIC RATING
162nd/ 347
METRIC RANK
17.4%
COGNITIVE DISABILITY
29.8/ 100
METRIC RATING
188th/ 347
METRIC RANK
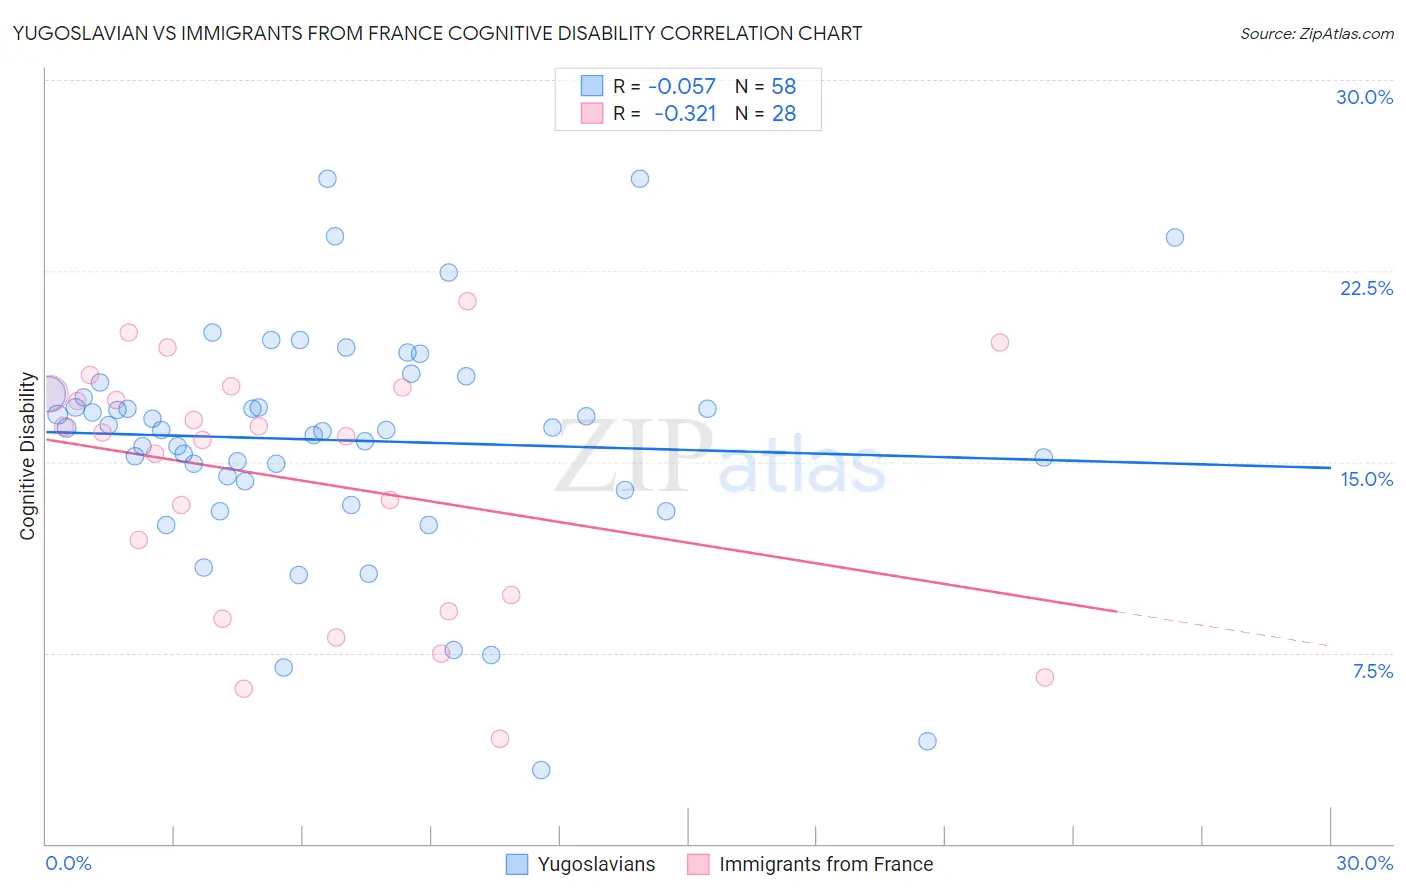
Yugoslavian vs Immigrants from France Cognitive Disability Correlation Chart
The statistical analysis conducted on geographies consisting of 285,698,583 people shows a slight negative correlation between the proportion of Yugoslavians and percentage of population with cognitive disability in the United States with a correlation coefficient (R) of -0.057 and weighted average of 17.2%. Similarly, the statistical analysis conducted on geographies consisting of 287,908,122 people shows a mild negative correlation between the proportion of Immigrants from France and percentage of population with cognitive disability in the United States with a correlation coefficient (R) of -0.321 and weighted average of 17.4%, a difference of 1.3%.
Cognitive Disability Correlation Summary
| Measurement | Yugoslavian | Immigrants from France |
| Minimum | 2.9% | 4.1% |
| Maximum | 26.1% | 21.3% |
| Range | 23.2% | 17.2% |
| Mean | 15.9% | 14.3% |
| Median | 16.3% | 16.1% |
| Interquartile 25% (IQ1) | 14.3% | 9.5% |
| Interquartile 75% (IQ3) | 17.7% | 17.8% |
| Interquartile Range (IQR) | 3.4% | 8.3% |
| Standard Deviation (Sample) | 4.5% | 4.9% |
| Standard Deviation (Population) | 4.5% | 4.8% |
Similar Demographics by Cognitive Disability
Demographics Similar to Yugoslavians by Cognitive Disability
In terms of cognitive disability, the demographic groups most similar to Yugoslavians are Immigrants from Switzerland (17.2%, a difference of 0.0%), American (17.2%, a difference of 0.020%), Australian (17.2%, a difference of 0.030%), Armenian (17.2%, a difference of 0.050%), and Immigrants from Latvia (17.2%, a difference of 0.060%).
| Demographics | Rating | Rank | Cognitive Disability |
| Brazilians | 78.9 /100 | #155 | Good 17.1% |
| Sri Lankans | 78.9 /100 | #156 | Good 17.1% |
| Immigrants | Australia | 76.0 /100 | #157 | Good 17.1% |
| Celtics | 74.1 /100 | #158 | Good 17.1% |
| Immigrants | Latvia | 73.2 /100 | #159 | Good 17.2% |
| Australians | 72.4 /100 | #160 | Good 17.2% |
| Americans | 72.2 /100 | #161 | Good 17.2% |
| Yugoslavians | 71.6 /100 | #162 | Good 17.2% |
| Immigrants | Switzerland | 71.5 /100 | #163 | Good 17.2% |
| Armenians | 70.1 /100 | #164 | Good 17.2% |
| Immigrants | Albania | 64.9 /100 | #165 | Good 17.2% |
| Immigrants | Ecuador | 64.4 /100 | #166 | Good 17.2% |
| Immigrants | Syria | 63.5 /100 | #167 | Good 17.2% |
| Immigrants | Immigrants | 62.5 /100 | #168 | Good 17.2% |
| Immigrants | Portugal | 61.8 /100 | #169 | Good 17.2% |
Demographics Similar to Immigrants from France by Cognitive Disability
In terms of cognitive disability, the demographic groups most similar to Immigrants from France are Immigrants from Western Asia (17.4%, a difference of 0.010%), Immigrants from Spain (17.4%, a difference of 0.070%), Nonimmigrants (17.4%, a difference of 0.080%), Immigrants from Haiti (17.4%, a difference of 0.090%), and Immigrants from Fiji (17.4%, a difference of 0.13%).
| Demographics | Rating | Rank | Cognitive Disability |
| Immigrants | Guyana | 42.9 /100 | #181 | Average 17.3% |
| Arabs | 42.8 /100 | #182 | Average 17.3% |
| Spaniards | 40.3 /100 | #183 | Average 17.3% |
| Crow | 39.1 /100 | #184 | Fair 17.3% |
| Afghans | 38.2 /100 | #185 | Fair 17.3% |
| Cambodians | 35.9 /100 | #186 | Fair 17.3% |
| Immigrants | Fiji | 33.7 /100 | #187 | Fair 17.4% |
| Immigrants | France | 29.8 /100 | #188 | Fair 17.4% |
| Immigrants | Western Asia | 29.5 /100 | #189 | Fair 17.4% |
| Immigrants | Spain | 27.7 /100 | #190 | Fair 17.4% |
| Immigrants | Nonimmigrants | 27.4 /100 | #191 | Fair 17.4% |
| Immigrants | Haiti | 27.1 /100 | #192 | Fair 17.4% |
| Delaware | 25.6 /100 | #193 | Fair 17.4% |
| Immigrants | Bosnia and Herzegovina | 22.0 /100 | #194 | Fair 17.4% |
| New Zealanders | 21.1 /100 | #195 | Fair 17.4% |