Immigrants from Hong Kong vs Argentinean Male Disability
COMPARE
Immigrants from Hong Kong
Argentinean
Male Disability
Male Disability Comparison
Immigrants from Hong Kong
Argentineans
9.4%
MALE DISABILITY
100.0/ 100
METRIC RATING
5th/ 347
METRIC RANK
10.1%
MALE DISABILITY
99.9/ 100
METRIC RATING
32nd/ 347
METRIC RANK
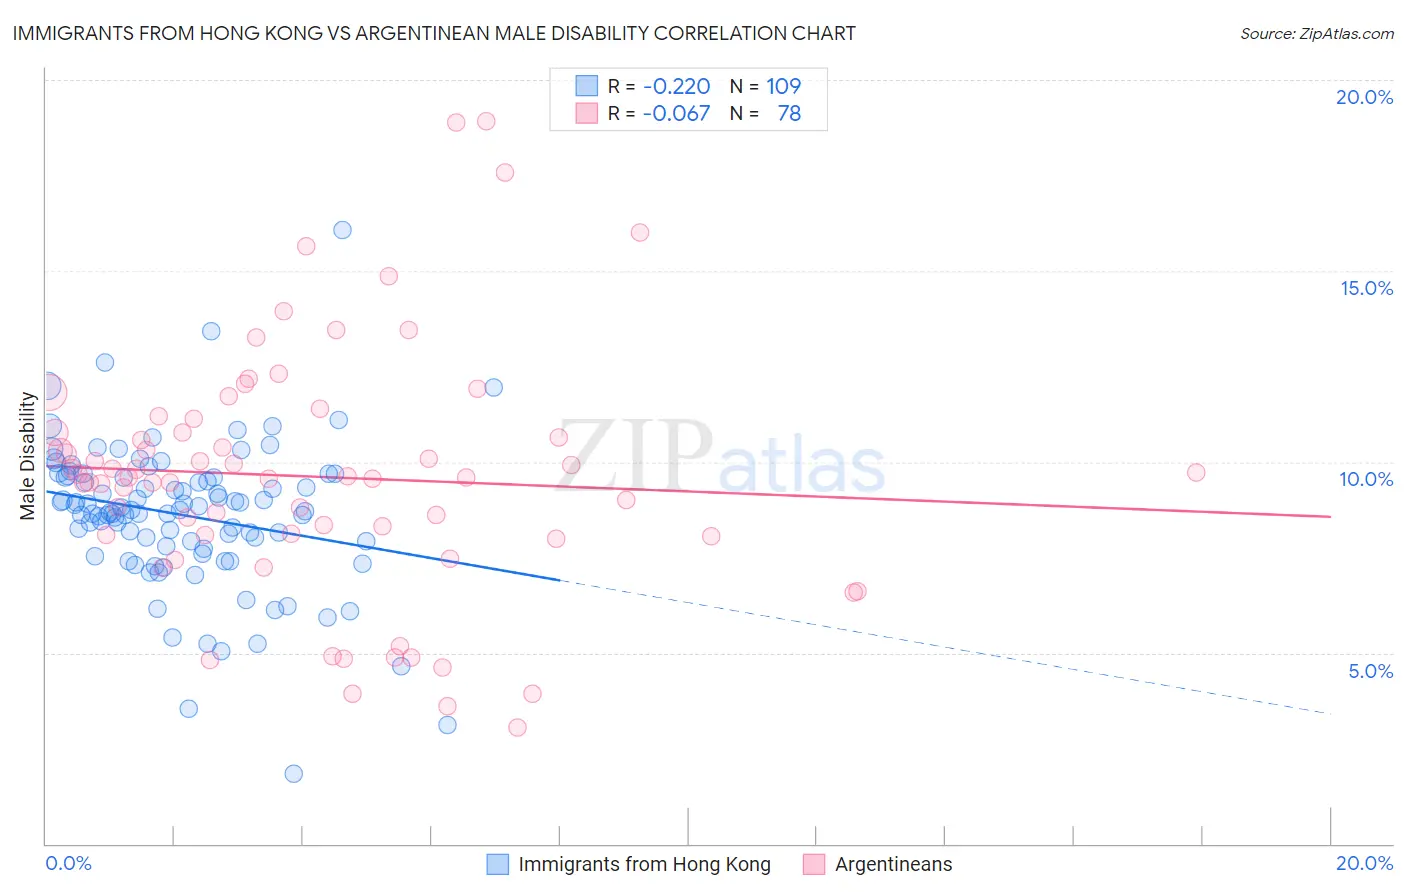
Immigrants from Hong Kong vs Argentinean Male Disability Correlation Chart
The statistical analysis conducted on geographies consisting of 253,984,960 people shows a weak negative correlation between the proportion of Immigrants from Hong Kong and percentage of males with a disability in the United States with a correlation coefficient (R) of -0.220 and weighted average of 9.4%. Similarly, the statistical analysis conducted on geographies consisting of 297,137,654 people shows a slight negative correlation between the proportion of Argentineans and percentage of males with a disability in the United States with a correlation coefficient (R) of -0.067 and weighted average of 10.1%, a difference of 7.5%.
Male Disability Correlation Summary
| Measurement | Immigrants from Hong Kong | Argentinean |
| Minimum | 1.8% | 3.0% |
| Maximum | 16.1% | 18.9% |
| Range | 14.3% | 15.9% |
| Mean | 8.6% | 9.6% |
| Median | 8.7% | 9.6% |
| Interquartile 25% (IQ1) | 7.8% | 8.1% |
| Interquartile 75% (IQ3) | 9.6% | 10.8% |
| Interquartile Range (IQR) | 1.9% | 2.7% |
| Standard Deviation (Sample) | 2.0% | 3.2% |
| Standard Deviation (Population) | 1.9% | 3.2% |
Similar Demographics by Male Disability
Demographics Similar to Immigrants from Hong Kong by Male Disability
In terms of male disability, the demographic groups most similar to Immigrants from Hong Kong are Immigrants from South Central Asia (9.4%, a difference of 0.060%), Immigrants from Bolivia (9.5%, a difference of 0.39%), Immigrants from China (9.5%, a difference of 0.99%), Immigrants from Singapore (9.5%, a difference of 1.1%), and Immigrants from Israel (9.6%, a difference of 1.5%).
| Demographics | Rating | Rank | Male Disability |
| Immigrants | India | 100.0 /100 | #1 | Exceptional 9.0% |
| Immigrants | Taiwan | 100.0 /100 | #2 | Exceptional 9.1% |
| Filipinos | 100.0 /100 | #3 | Exceptional 9.1% |
| Thais | 100.0 /100 | #4 | Exceptional 9.2% |
| Immigrants | Hong Kong | 100.0 /100 | #5 | Exceptional 9.4% |
| Immigrants | South Central Asia | 100.0 /100 | #6 | Exceptional 9.4% |
| Immigrants | Bolivia | 100.0 /100 | #7 | Exceptional 9.5% |
| Immigrants | China | 100.0 /100 | #8 | Exceptional 9.5% |
| Immigrants | Singapore | 100.0 /100 | #9 | Exceptional 9.5% |
| Immigrants | Israel | 100.0 /100 | #10 | Exceptional 9.6% |
| Immigrants | Eastern Asia | 100.0 /100 | #11 | Exceptional 9.6% |
| Bolivians | 100.0 /100 | #12 | Exceptional 9.6% |
| Iranians | 100.0 /100 | #13 | Exceptional 9.7% |
| Immigrants | Iran | 100.0 /100 | #14 | Exceptional 9.7% |
| Indians (Asian) | 100.0 /100 | #15 | Exceptional 9.7% |
Demographics Similar to Argentineans by Male Disability
In terms of male disability, the demographic groups most similar to Argentineans are Soviet Union (10.1%, a difference of 0.15%), Immigrants from Egypt (10.1%, a difference of 0.22%), Venezuelan (10.1%, a difference of 0.25%), Vietnamese (10.1%, a difference of 0.41%), and Egyptian (10.1%, a difference of 0.43%).
| Demographics | Rating | Rank | Male Disability |
| Immigrants | Malaysia | 99.9 /100 | #25 | Exceptional 10.0% |
| Paraguayans | 99.9 /100 | #26 | Exceptional 10.1% |
| Egyptians | 99.9 /100 | #27 | Exceptional 10.1% |
| Vietnamese | 99.9 /100 | #28 | Exceptional 10.1% |
| Venezuelans | 99.9 /100 | #29 | Exceptional 10.1% |
| Immigrants | Egypt | 99.9 /100 | #30 | Exceptional 10.1% |
| Soviet Union | 99.9 /100 | #31 | Exceptional 10.1% |
| Argentineans | 99.9 /100 | #32 | Exceptional 10.1% |
| Immigrants | Ethiopia | 99.9 /100 | #33 | Exceptional 10.2% |
| Immigrants | Turkey | 99.9 /100 | #34 | Exceptional 10.2% |
| Immigrants | Argentina | 99.9 /100 | #35 | Exceptional 10.2% |
| Ethiopians | 99.8 /100 | #36 | Exceptional 10.2% |
| Immigrants | Indonesia | 99.8 /100 | #37 | Exceptional 10.2% |
| Immigrants | Kuwait | 99.8 /100 | #38 | Exceptional 10.2% |
| Afghans | 99.8 /100 | #39 | Exceptional 10.2% |