Creek vs African Cognitive Disability
COMPARE
Creek
African
Cognitive Disability
Cognitive Disability Comparison
Creek
Africans
18.3%
COGNITIVE DISABILITY
0.0/ 100
METRIC RATING
300th/ 347
METRIC RANK
18.6%
COGNITIVE DISABILITY
0.0/ 100
METRIC RATING
321st/ 347
METRIC RANK
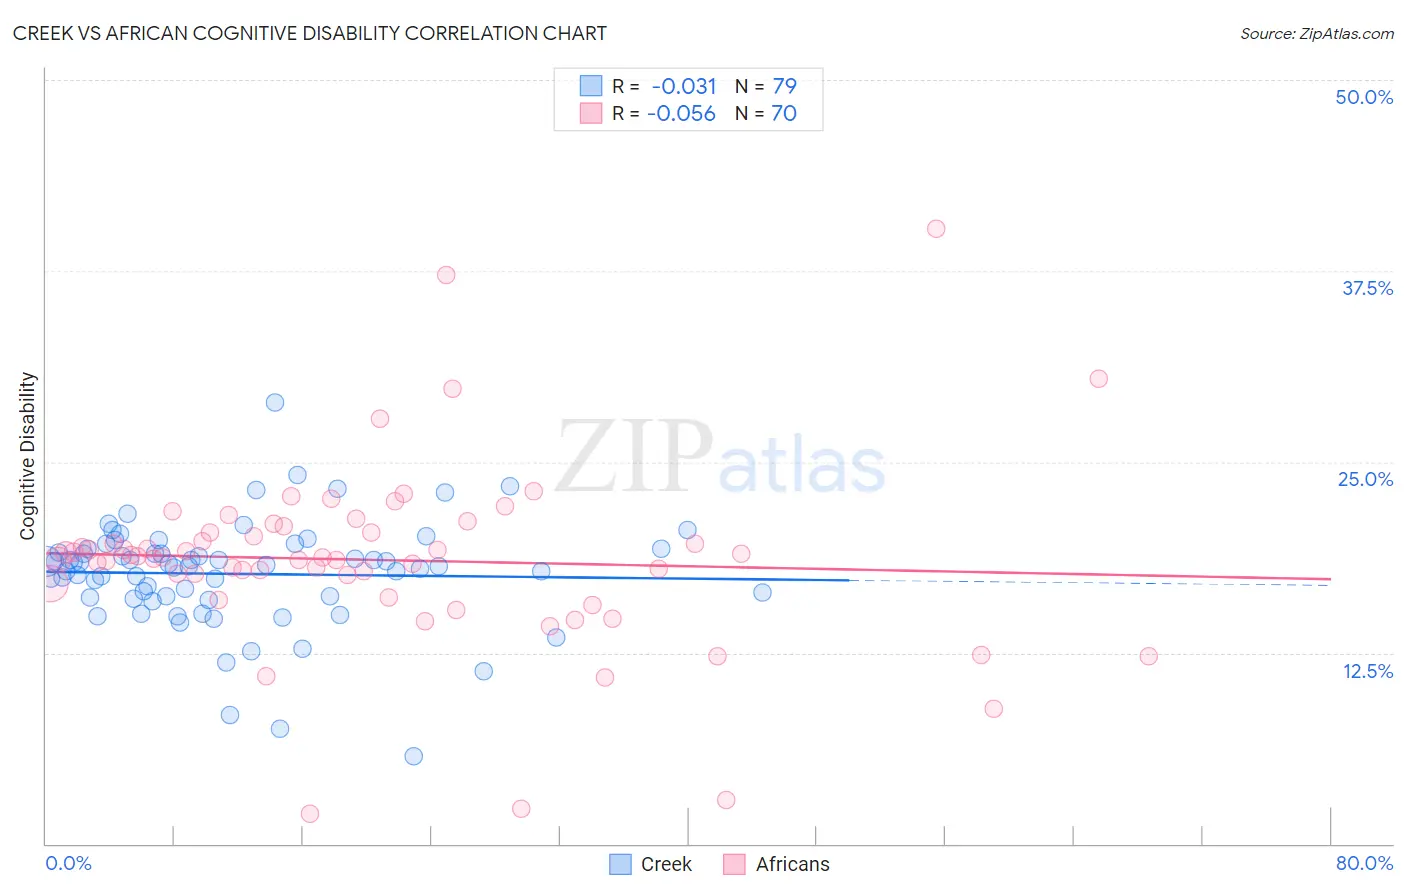
Creek vs African Cognitive Disability Correlation Chart
The statistical analysis conducted on geographies consisting of 178,450,672 people shows no correlation between the proportion of Creek and percentage of population with cognitive disability in the United States with a correlation coefficient (R) of -0.031 and weighted average of 18.3%. Similarly, the statistical analysis conducted on geographies consisting of 469,983,328 people shows a slight negative correlation between the proportion of Africans and percentage of population with cognitive disability in the United States with a correlation coefficient (R) of -0.056 and weighted average of 18.6%, a difference of 2.0%.
Cognitive Disability Correlation Summary
| Measurement | Creek | African |
| Minimum | 5.7% | 2.0% |
| Maximum | 28.9% | 40.3% |
| Range | 23.2% | 38.3% |
| Mean | 17.7% | 18.6% |
| Median | 18.2% | 18.8% |
| Interquartile 25% (IQ1) | 16.1% | 17.0% |
| Interquartile 75% (IQ3) | 19.3% | 20.4% |
| Interquartile Range (IQR) | 3.2% | 3.4% |
| Standard Deviation (Sample) | 3.5% | 6.1% |
| Standard Deviation (Population) | 3.5% | 6.0% |
Similar Demographics by Cognitive Disability
Demographics Similar to Creek by Cognitive Disability
In terms of cognitive disability, the demographic groups most similar to Creek are Ghanaian (18.3%, a difference of 0.020%), Blackfeet (18.3%, a difference of 0.060%), Japanese (18.3%, a difference of 0.060%), Immigrants from Ghana (18.3%, a difference of 0.14%), and Immigrants from Burma/Myanmar (18.2%, a difference of 0.20%).
| Demographics | Rating | Rank | Cognitive Disability |
| Central American Indians | 0.1 /100 | #293 | Tragic 18.2% |
| British West Indians | 0.1 /100 | #294 | Tragic 18.2% |
| German Russians | 0.0 /100 | #295 | Tragic 18.2% |
| Immigrants | Burma/Myanmar | 0.0 /100 | #296 | Tragic 18.2% |
| Blackfeet | 0.0 /100 | #297 | Tragic 18.3% |
| Japanese | 0.0 /100 | #298 | Tragic 18.3% |
| Ghanaians | 0.0 /100 | #299 | Tragic 18.3% |
| Creek | 0.0 /100 | #300 | Tragic 18.3% |
| Immigrants | Ghana | 0.0 /100 | #301 | Tragic 18.3% |
| Barbadians | 0.0 /100 | #302 | Tragic 18.3% |
| Immigrants | Kenya | 0.0 /100 | #303 | Tragic 18.3% |
| Immigrants | Eritrea | 0.0 /100 | #304 | Tragic 18.3% |
| Colville | 0.0 /100 | #305 | Tragic 18.3% |
| Seminole | 0.0 /100 | #306 | Tragic 18.3% |
| Ugandans | 0.0 /100 | #307 | Tragic 18.3% |
Demographics Similar to Africans by Cognitive Disability
In terms of cognitive disability, the demographic groups most similar to Africans are Immigrants from Liberia (18.7%, a difference of 0.060%), Pueblo (18.7%, a difference of 0.080%), Apache (18.6%, a difference of 0.090%), Comanche (18.6%, a difference of 0.13%), and Bangladeshi (18.6%, a difference of 0.17%).
| Demographics | Rating | Rank | Cognitive Disability |
| Sub-Saharan Africans | 0.0 /100 | #314 | Tragic 18.5% |
| Immigrants | Dominica | 0.0 /100 | #315 | Tragic 18.6% |
| Immigrants | Middle Africa | 0.0 /100 | #316 | Tragic 18.6% |
| Liberians | 0.0 /100 | #317 | Tragic 18.6% |
| Bangladeshis | 0.0 /100 | #318 | Tragic 18.6% |
| Comanche | 0.0 /100 | #319 | Tragic 18.6% |
| Apache | 0.0 /100 | #320 | Tragic 18.6% |
| Africans | 0.0 /100 | #321 | Tragic 18.6% |
| Immigrants | Liberia | 0.0 /100 | #322 | Tragic 18.7% |
| Pueblo | 0.0 /100 | #323 | Tragic 18.7% |
| Dominicans | 0.0 /100 | #324 | Tragic 18.7% |
| Indonesians | 0.0 /100 | #325 | Tragic 18.7% |
| Immigrants | Senegal | 0.0 /100 | #326 | Tragic 18.7% |
| U.S. Virgin Islanders | 0.0 /100 | #327 | Tragic 18.7% |
| Kiowa | 0.0 /100 | #328 | Tragic 18.7% |