Immigrants from Moldova vs African Cognitive Disability
COMPARE
Immigrants from Moldova
African
Cognitive Disability
Cognitive Disability Comparison
Immigrants from Moldova
Africans
16.7%
COGNITIVE DISABILITY
99.1/ 100
METRIC RATING
85th/ 347
METRIC RANK
18.6%
COGNITIVE DISABILITY
0.0/ 100
METRIC RATING
321st/ 347
METRIC RANK
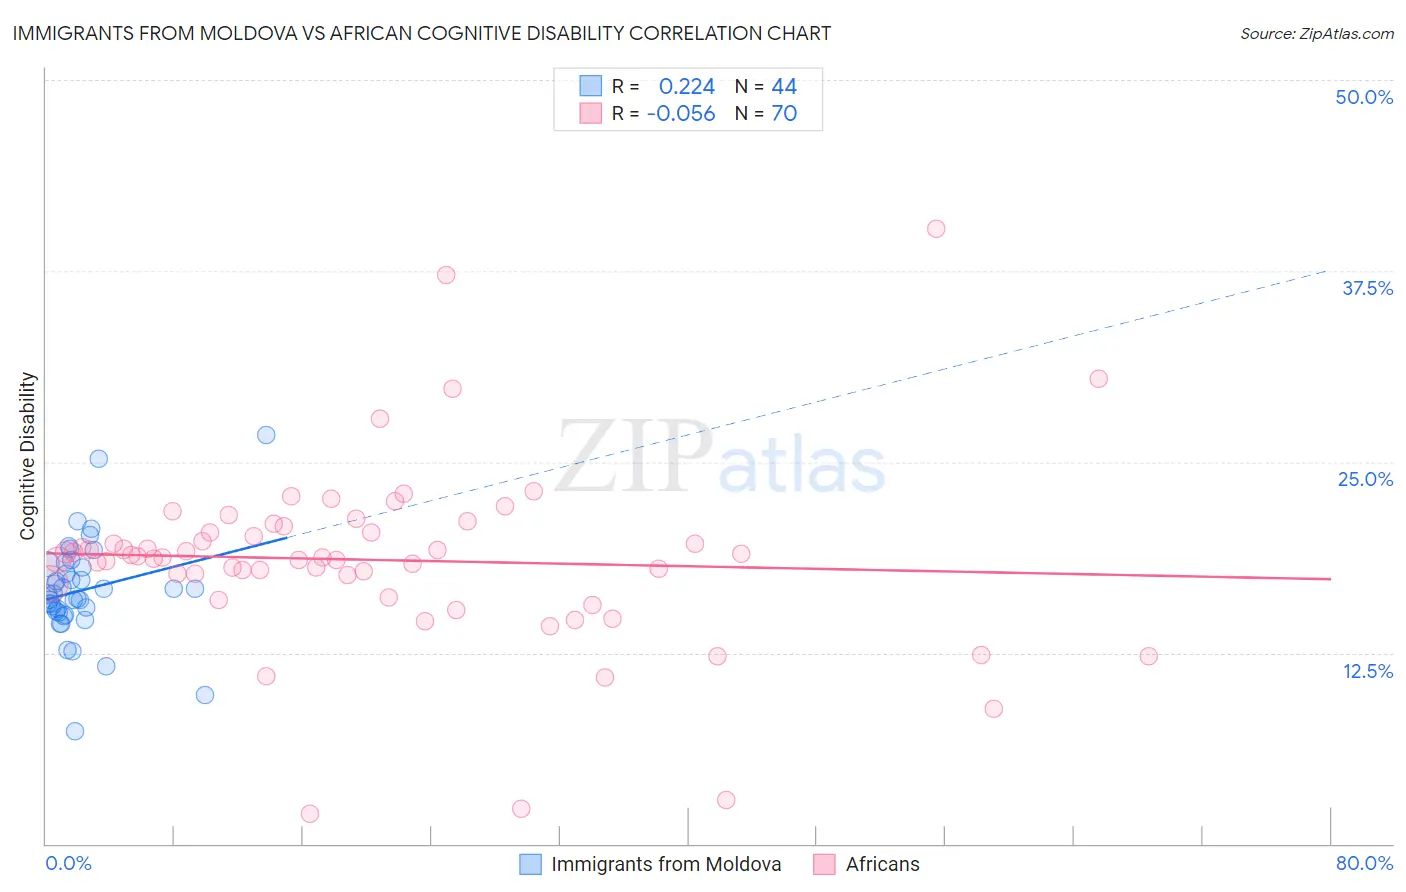
Immigrants from Moldova vs African Cognitive Disability Correlation Chart
The statistical analysis conducted on geographies consisting of 124,376,689 people shows a weak positive correlation between the proportion of Immigrants from Moldova and percentage of population with cognitive disability in the United States with a correlation coefficient (R) of 0.224 and weighted average of 16.7%. Similarly, the statistical analysis conducted on geographies consisting of 469,983,328 people shows a slight negative correlation between the proportion of Africans and percentage of population with cognitive disability in the United States with a correlation coefficient (R) of -0.056 and weighted average of 18.6%, a difference of 11.6%.
Cognitive Disability Correlation Summary
| Measurement | Immigrants from Moldova | African |
| Minimum | 7.4% | 2.0% |
| Maximum | 26.8% | 40.3% |
| Range | 19.4% | 38.3% |
| Mean | 16.6% | 18.6% |
| Median | 16.4% | 18.8% |
| Interquartile 25% (IQ1) | 15.2% | 17.0% |
| Interquartile 75% (IQ3) | 18.2% | 20.4% |
| Interquartile Range (IQR) | 3.0% | 3.4% |
| Standard Deviation (Sample) | 3.4% | 6.1% |
| Standard Deviation (Population) | 3.3% | 6.0% |
Similar Demographics by Cognitive Disability
Demographics Similar to Immigrants from Moldova by Cognitive Disability
In terms of cognitive disability, the demographic groups most similar to Immigrants from Moldova are Belgian (16.7%, a difference of 0.020%), Serbian (16.7%, a difference of 0.030%), Immigrants from South Africa (16.7%, a difference of 0.030%), Native Hawaiian (16.7%, a difference of 0.050%), and Swiss (16.7%, a difference of 0.10%).
| Demographics | Rating | Rank | Cognitive Disability |
| Peruvians | 99.3 /100 | #78 | Exceptional 16.7% |
| Immigrants | Bulgaria | 99.3 /100 | #79 | Exceptional 16.7% |
| Egyptians | 99.2 /100 | #80 | Exceptional 16.7% |
| Immigrants | Netherlands | 99.2 /100 | #81 | Exceptional 16.7% |
| Swiss | 99.2 /100 | #82 | Exceptional 16.7% |
| Serbians | 99.1 /100 | #83 | Exceptional 16.7% |
| Belgians | 99.1 /100 | #84 | Exceptional 16.7% |
| Immigrants | Moldova | 99.1 /100 | #85 | Exceptional 16.7% |
| Immigrants | South Africa | 99.0 /100 | #86 | Exceptional 16.7% |
| Native Hawaiians | 99.0 /100 | #87 | Exceptional 16.7% |
| Immigrants | Philippines | 99.0 /100 | #88 | Exceptional 16.7% |
| Immigrants | Egypt | 98.8 /100 | #89 | Exceptional 16.7% |
| South Americans | 98.8 /100 | #90 | Exceptional 16.7% |
| Danes | 98.8 /100 | #91 | Exceptional 16.7% |
| Immigrants | South America | 98.8 /100 | #92 | Exceptional 16.7% |
Demographics Similar to Africans by Cognitive Disability
In terms of cognitive disability, the demographic groups most similar to Africans are Immigrants from Liberia (18.7%, a difference of 0.060%), Pueblo (18.7%, a difference of 0.080%), Apache (18.6%, a difference of 0.090%), Comanche (18.6%, a difference of 0.13%), and Bangladeshi (18.6%, a difference of 0.17%).
| Demographics | Rating | Rank | Cognitive Disability |
| Sub-Saharan Africans | 0.0 /100 | #314 | Tragic 18.5% |
| Immigrants | Dominica | 0.0 /100 | #315 | Tragic 18.6% |
| Immigrants | Middle Africa | 0.0 /100 | #316 | Tragic 18.6% |
| Liberians | 0.0 /100 | #317 | Tragic 18.6% |
| Bangladeshis | 0.0 /100 | #318 | Tragic 18.6% |
| Comanche | 0.0 /100 | #319 | Tragic 18.6% |
| Apache | 0.0 /100 | #320 | Tragic 18.6% |
| Africans | 0.0 /100 | #321 | Tragic 18.6% |
| Immigrants | Liberia | 0.0 /100 | #322 | Tragic 18.7% |
| Pueblo | 0.0 /100 | #323 | Tragic 18.7% |
| Dominicans | 0.0 /100 | #324 | Tragic 18.7% |
| Indonesians | 0.0 /100 | #325 | Tragic 18.7% |
| Immigrants | Senegal | 0.0 /100 | #326 | Tragic 18.7% |
| U.S. Virgin Islanders | 0.0 /100 | #327 | Tragic 18.7% |
| Kiowa | 0.0 /100 | #328 | Tragic 18.7% |