Norwegian vs Immigrants from Uganda 12th Grade, No Diploma

COMPARE

Norwegian
Race
Ancestry
AfghanAfricanAlaska NativeAlaskan AthabascanAlbanianAleutAlsatianAmericanApacheArabArapahoArgentineanArmenianAssyrian/Chaldean/SyriacAustralianAustrianBahamianBangladeshiBarbadianBasqueBelgianBelizeanBermudanBhutaneseBlackfeetBolivianBrazilianBritishBritish West IndianBulgarianBurmeseCajunCambodianCanadianCape VerdeanCarpatho RusynCelticCentral AmericanCentral American IndianCherokeeCheyenneChickasawChileanChineseChippewaChoctawColombianColvilleComancheCosta RicanCreeCreekCroatianCrowCubanCypriotCzechCzechoslovakianDanishDelawareDominicanDutchDutch West IndianEastern EuropeanEcuadorianEgyptianEnglishEstonianEthiopianEuropeanFijianFilipinoFinnishFrenchFrench American IndianFrench CanadianGermanGerman RussianGhanaianGreekGuamanian/ChamorroGuatemalanGuyaneseHaitianHmongHonduranHopiHoumaHungarianIcelanderIndian (Asian)IndonesianInupiatIranianIraqiIrishIroquoisIsraeliItalianJamaicanJapaneseJordanianKenyanKiowaKoreanLaotianLatvianLebaneseLiberianLithuanianLumbeeLuxembourgerMacedonianMalaysianMalteseMarshalleseMenomineeMexicanMexican American IndianMongolianMoroccanNative HawaiianNavajoNepaleseNew ZealanderNicaraguanNigerianNorthern EuropeanNorwegianOkinawanOsageOttawaPaiutePakistaniPalestinianPanamanianParaguayanPennsylvania GermanPeruvianPimaPolishPortuguesePotawatomiPuebloPuerto RicanPuget Sound SalishRomanianRussianSalvadoranSamoanScandinavianScotch-IrishScottishSeminoleSenegaleseSerbianShoshoneSierra LeoneanSiouxSlavicSlovakSloveneSomaliSouth AfricanSouth AmericanSouth American IndianSoviet UnionSpaniardSpanishSpanish AmericanSpanish American IndianSri LankanSubsaharan AfricanSudaneseSwedishSwissSyrianTaiwaneseThaiTlingit-HaidaTohono O'OdhamTonganTrinidadian and TobagonianTsimshianTurkishU.S. Virgin IslanderUgandanUkrainianUruguayanUteVenezuelanVietnameseWelshWest IndianYakamaYaquiYugoslavianYumanYup'ikZimbabwean
Immigration
NonimmigrantsImmigrantsAfghanistanAfricaAlbaniaArgentinaArmeniaAsiaAustraliaAustriaBahamasBangladeshBarbadosBelarusBelgiumBelizeBoliviaBosnia and HerzegovinaBrazilBulgariaBurma/MyanmarCabo VerdeCambodiaCameroonCanadaCaribbeanCentral AmericaChileChinaColombiaCongoCosta RicaCroatiaCubaCzechoslovakiaDenmarkDominicaDominican RepublicEastern AfricaEastern AsiaEastern EuropeEcuadorEgyptEl SalvadorEnglandEritreaEthiopiaEuropeFijiFranceGermanyGhanaGreeceGrenadaGuatemalaGuyanaHaitiHondurasHong KongHungaryIndiaIndonesiaIranIraqIrelandIsraelItalyJamaicaJapanJordanKazakhstanKenyaKoreaKuwaitLaosLatin AmericaLatviaLebanonLiberiaLithuaniaMalaysiaMexicoMicronesiaMiddle AfricaMoldovaMoroccoNepalNetherlandsNicaraguaNigeriaNorth AmericaNorth MacedoniaNorthern AfricaNorthern EuropeNorwayOceaniaPakistanPanamaPeruPhilippinesPolandPortugalRomaniaRussiaSaudi ArabiaScotlandSenegalSerbiaSierra LeoneSingaporeSomaliaSouth AfricaSouth AmericaSouth Central AsiaSouth Eastern AsiaSouthern EuropeSpainSri LankaSt. Vincent and the GrenadinesSudanSwedenSwitzerlandSyriaTaiwanThailandTrinidad and TobagoTurkeyUkraineUruguayUzbekistanVenezuelaVietnamWest IndiesWestern AfricaWestern AsiaWestern EuropeYemenZaireZimbabweAzores
Immigrants from Uganda
Race
Ancestry
AfghanAfricanAlaska NativeAlaskan AthabascanAlbanianAleutAlsatianAmericanApacheArabArapahoArgentineanArmenianAssyrian/Chaldean/SyriacAustralianAustrianBahamianBangladeshiBarbadianBasqueBelgianBelizeanBermudanBhutaneseBlackfeetBolivianBrazilianBritishBritish West IndianBulgarianBurmeseCajunCambodianCanadianCape VerdeanCarpatho RusynCelticCentral AmericanCentral American IndianCherokeeCheyenneChickasawChileanChineseChippewaChoctawColombianColvilleComancheCosta RicanCreeCreekCroatianCrowCubanCypriotCzechCzechoslovakianDanishDelawareDominicanDutchDutch West IndianEastern EuropeanEcuadorianEgyptianEnglishEstonianEthiopianEuropeanFijianFilipinoFinnishFrenchFrench American IndianFrench CanadianGermanGerman RussianGhanaianGreekGuamanian/ChamorroGuatemalanGuyaneseHaitianHmongHonduranHopiHoumaHungarianIcelanderIndian (Asian)IndonesianInupiatIranianIraqiIrishIroquoisIsraeliItalianJamaicanJapaneseJordanianKenyanKiowaKoreanLaotianLatvianLebaneseLiberianLithuanianLumbeeLuxembourgerMacedonianMalaysianMalteseMarshalleseMenomineeMexicanMexican American IndianMongolianMoroccanNative HawaiianNavajoNepaleseNew ZealanderNicaraguanNigerianNorthern EuropeanOkinawanOsageOttawaPaiutePakistaniPalestinianPanamanianParaguayanPennsylvania GermanPeruvianPimaPolishPortuguesePotawatomiPuebloPuerto RicanPuget Sound SalishRomanianRussianSalvadoranSamoanScandinavianScotch-IrishScottishSeminoleSenegaleseSerbianShoshoneSierra LeoneanSiouxSlavicSlovakSloveneSomaliSouth AfricanSouth AmericanSouth American IndianSoviet UnionSpaniardSpanishSpanish AmericanSpanish American IndianSri LankanSubsaharan AfricanSudaneseSwedishSwissSyrianTaiwaneseThaiTlingit-HaidaTohono O'OdhamTonganTrinidadian and TobagonianTsimshianTurkishU.S. Virgin IslanderUgandanUkrainianUruguayanUteVenezuelanVietnameseWelshWest IndianYakamaYaquiYugoslavianYumanYup'ikZimbabwean
Immigration
NonimmigrantsImmigrantsAfghanistanAfricaAlbaniaArgentinaArmeniaAsiaAustraliaAustriaBahamasBangladeshBarbadosBelarusBelgiumBelizeBoliviaBosnia and HerzegovinaBrazilBulgariaBurma/MyanmarCabo VerdeCambodiaCameroonCanadaCaribbeanCentral AmericaChileChinaColombiaCongoCosta RicaCroatiaCubaCzechoslovakiaDenmarkDominicaDominican RepublicEastern AfricaEastern AsiaEastern EuropeEcuadorEgyptEl SalvadorEnglandEritreaEthiopiaEuropeFijiFranceGermanyGhanaGreeceGrenadaGuatemalaGuyanaHaitiHondurasHong KongHungaryIndiaIndonesiaIranIraqIrelandIsraelItalyJamaicaJapanJordanKazakhstanKenyaKoreaKuwaitLaosLatin AmericaLatviaLebanonLiberiaLithuaniaMalaysiaMexicoMicronesiaMiddle AfricaMoldovaMoroccoNepalNetherlandsNicaraguaNigeriaNorth AmericaNorth MacedoniaNorthern AfricaNorthern EuropeNorwayOceaniaPakistanPanamaPeruPhilippinesPolandPortugalRomaniaRussiaSaudi ArabiaScotlandSenegalSerbiaSierra LeoneSingaporeSomaliaSouth AfricaSouth AmericaSouth Central AsiaSouth Eastern AsiaSouthern EuropeSpainSri LankaSt. Vincent and the GrenadinesSudanSwedenSwitzerlandSyriaTaiwanThailandTrinidad and TobagoTurkeyUgandaUkraineUruguayUzbekistanVenezuelaVietnamWest IndiesWestern AfricaWestern AsiaWestern EuropeYemenZaireZimbabweAzores
12th Grade, No Diploma
Income
Poverty
Unemployment
Labor Participation
Family Structure
Vehicle Availability
Education Level
Disability

12th Grade, No Diploma Comparison

Norwegians

Immigrants from Uganda

Exceptional
Fair
94.0%
12TH GRADE, NO DIPLOMA
100.0/ 100
METRIC RATING
1st/ 347
METRIC RANK
90.9%
12TH GRADE, NO DIPLOMA
31.6/ 100
METRIC RATING
189th/ 347
METRIC RANK

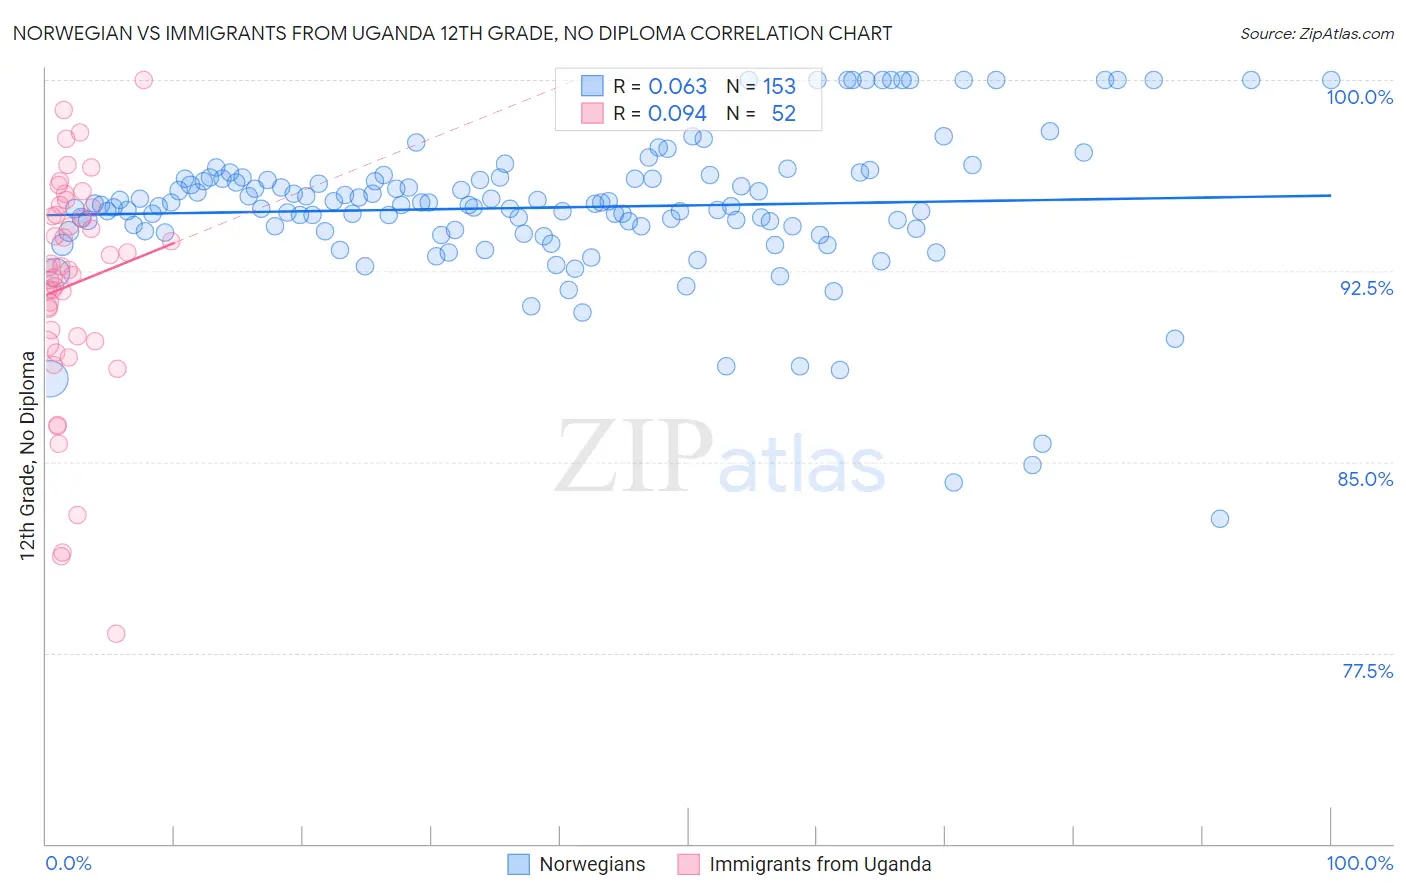
Norwegian vs Immigrants from Uganda 12th Grade, No Diploma Correlation Chart

The statistical analysis conducted on geographies consisting of 533,395,758 people shows a slight positive correlation between the proportion of Norwegians and percentage of population with at least 12th grade (no diploma) education in the United States with a correlation coefficient (R) of 0.063 and weighted average of 94.0%. Similarly, the statistical analysis conducted on geographies consisting of 125,969,169 people shows a slight positive correlation between the proportion of Immigrants from Uganda and percentage of population with at least 12th grade (no diploma) education in the United States with a correlation coefficient (R) of 0.094 and weighted average of 90.9%, a difference of 3.4%.
Norwegian vs Immigrants from Uganda 12th Grade, No Diploma

12th Grade, No Diploma Correlation Summary

MeasurementNorwegianImmigrants from Uganda
Minimum82.8%78.2%
Maximum100.0%100.0%
Range17.2%21.8%
Mean95.0%92.0%
Median95.1%92.6%
Interquartile 25% (IQ1)94.1%89.9%
Interquartile 75% (IQ3)96.1%94.9%
Interquartile Range (IQR)2.1%5.0%
Standard Deviation (Sample)2.9%4.4%
Standard Deviation (Population)2.9%4.4%

Similar Demographics by 12th Grade, No Diploma

Demographics Similar to Norwegians by 12th Grade, No Diploma

In terms of 12th grade, no diploma, the demographic groups most similar to Norwegians are Swedish (93.7%, a difference of 0.30%), Lithuanian (93.6%, a difference of 0.40%), Slovene (93.6%, a difference of 0.41%), Carpatho Rusyn (93.6%, a difference of 0.42%), and Immigrants from India (93.6%, a difference of 0.43%).
DemographicsRating | Rank12th Grade, No Diploma
Norwegians
100.0
/100
|
#1
Exceptional
94.0%
Swedes
100.0
/100
|
#2
Exceptional
93.7%
Lithuanians
100.0
/100
|
#3
Exceptional
93.6%
Slovenes
100.0
/100
|
#4
Exceptional
93.6%
Carpatho Rusyns
100.0
/100
|
#5
Exceptional
93.6%
Immigrants | India
100.0
/100
|
#6
Exceptional
93.6%
Slovaks
100.0
/100
|
#7
Exceptional
93.6%
Chinese
100.0
/100
|
#8
Exceptional
93.6%
Latvians
100.0
/100
|
#9
Exceptional
93.6%
Croatians
100.0
/100
|
#10
Exceptional
93.5%
Poles
100.0
/100
|
#11
Exceptional
93.5%
Eastern Europeans
100.0
/100
|
#12
Exceptional
93.5%
Danes
100.0
/100
|
#13
Exceptional
93.5%
Bulgarians
100.0
/100
|
#14
Exceptional
93.5%
Finns
100.0
/100
|
#15
Exceptional
93.4%

Demographics Similar to Immigrants from Uganda by 12th Grade, No Diploma

In terms of 12th grade, no diploma, the demographic groups most similar to Immigrants from Uganda are American (91.0%, a difference of 0.010%), Potawatomi (91.0%, a difference of 0.020%), Ethiopian (91.0%, a difference of 0.030%), Afghan (90.9%, a difference of 0.030%), and Sudanese (91.0%, a difference of 0.040%).
DemographicsRating | Rank12th Grade, No Diploma
Immigrants | Nonimmigrants
38.8
/100
|
#182
Fair
91.0%
Osage
38.3
/100
|
#183
Fair
91.0%
Spaniards
36.2
/100
|
#184
Fair
91.0%
Sudanese
34.4
/100
|
#185
Fair
91.0%
Ethiopians
33.9
/100
|
#186
Fair
91.0%
Potawatomi
32.9
/100
|
#187
Fair
91.0%
Americans
32.6
/100
|
#188
Fair
91.0%
Immigrants | Uganda
31.6
/100
|
#189
Fair
90.9%
Afghans
29.9
/100
|
#190
Fair
90.9%
Moroccans
28.8
/100
|
#191
Fair
90.9%
Immigrants | Eastern Africa
27.7
/100
|
#192
Fair
90.9%
Immigrants | Ethiopia
27.2
/100
|
#193
Fair
90.9%
Immigrants | Oceania
26.0
/100
|
#194
Fair
90.9%
Koreans
24.5
/100
|
#195
Fair
90.8%
Panamanians
22.8
/100
|
#196
Fair
90.8%