Nonimmigrants vs Immigrants from Belgium Disability Age 18 to 34

COMPARE

Nonimmigrants
Race
Ancestry
AfghanAfricanAlaska NativeAlaskan AthabascanAlbanianAleutAlsatianAmericanApacheArabArapahoArgentineanArmenianAssyrian/Chaldean/SyriacAustralianAustrianBahamianBangladeshiBarbadianBasqueBelgianBelizeanBermudanBhutaneseBlackfeetBolivianBrazilianBritishBritish West IndianBulgarianBurmeseCajunCambodianCanadianCape VerdeanCarpatho RusynCelticCentral AmericanCentral American IndianCherokeeCheyenneChickasawChileanChineseChippewaChoctawColombianColvilleComancheCosta RicanCreeCreekCroatianCrowCubanCypriotCzechCzechoslovakianDanishDelawareDominicanDutchDutch West IndianEastern EuropeanEcuadorianEgyptianEnglishEstonianEthiopianEuropeanFijianFilipinoFinnishFrenchFrench American IndianFrench CanadianGermanGerman RussianGhanaianGreekGuamanian/ChamorroGuatemalanGuyaneseHaitianHmongHonduranHopiHoumaHungarianIcelanderIndian (Asian)IndonesianInupiatIranianIraqiIrishIroquoisIsraeliItalianJamaicanJapaneseJordanianKenyanKiowaKoreanLaotianLatvianLebaneseLiberianLithuanianLumbeeLuxembourgerMacedonianMalaysianMalteseMarshalleseMenomineeMexicanMexican American IndianMongolianMoroccanNative HawaiianNavajoNepaleseNew ZealanderNicaraguanNigerianNorthern EuropeanNorwegianOkinawanOsageOttawaPaiutePakistaniPalestinianPanamanianParaguayanPennsylvania GermanPeruvianPimaPolishPortuguesePotawatomiPuebloPuerto RicanPuget Sound SalishRomanianRussianSalvadoranSamoanScandinavianScotch-IrishScottishSeminoleSenegaleseSerbianShoshoneSierra LeoneanSiouxSlavicSlovakSloveneSomaliSouth AfricanSouth AmericanSouth American IndianSoviet UnionSpaniardSpanishSpanish AmericanSpanish American IndianSri LankanSubsaharan AfricanSudaneseSwedishSwissSyrianTaiwaneseThaiTlingit-HaidaTohono O'OdhamTonganTrinidadian and TobagonianTsimshianTurkishU.S. Virgin IslanderUgandanUkrainianUruguayanUteVenezuelanVietnameseWelshWest IndianYakamaYaquiYugoslavianYumanYup'ikZimbabwean
Immigration
NonimmigrantsImmigrantsAfghanistanAfricaAlbaniaArgentinaArmeniaAsiaAustraliaAustriaBahamasBangladeshBarbadosBelarusBelizeBoliviaBosnia and HerzegovinaBrazilBulgariaBurma/MyanmarCabo VerdeCambodiaCameroonCanadaCaribbeanCentral AmericaChileChinaColombiaCongoCosta RicaCroatiaCubaCzechoslovakiaDenmarkDominicaDominican RepublicEastern AfricaEastern AsiaEastern EuropeEcuadorEgyptEl SalvadorEnglandEritreaEthiopiaEuropeFijiFranceGermanyGhanaGreeceGrenadaGuatemalaGuyanaHaitiHondurasHong KongHungaryIndiaIndonesiaIranIraqIrelandIsraelItalyJamaicaJapanJordanKazakhstanKenyaKoreaKuwaitLaosLatin AmericaLatviaLebanonLiberiaLithuaniaMalaysiaMexicoMicronesiaMiddle AfricaMoldovaMoroccoNepalNetherlandsNicaraguaNigeriaNorth AmericaNorth MacedoniaNorthern AfricaNorthern EuropeNorwayOceaniaPakistanPanamaPeruPhilippinesPolandPortugalRomaniaRussiaSaudi ArabiaScotlandSenegalSerbiaSierra LeoneSingaporeSomaliaSouth AfricaSouth AmericaSouth Central AsiaSouth Eastern AsiaSouthern EuropeSpainSri LankaSt. Vincent and the GrenadinesSudanSwedenSwitzerlandSyriaTaiwanThailandTrinidad and TobagoTurkeyUgandaUkraineUruguayUzbekistanVenezuelaVietnamWest IndiesWestern AfricaWestern AsiaWestern EuropeYemenZaireZimbabweAzores
Immigrants from Belgium
Race
Ancestry
AfghanAfricanAlaska NativeAlaskan AthabascanAlbanianAleutAlsatianAmericanApacheArabArapahoArgentineanArmenianAssyrian/Chaldean/SyriacAustralianAustrianBahamianBangladeshiBarbadianBasqueBelgianBelizeanBermudanBhutaneseBlackfeetBolivianBrazilianBritishBritish West IndianBulgarianBurmeseCajunCambodianCanadianCape VerdeanCarpatho RusynCelticCentral AmericanCentral American IndianCherokeeCheyenneChickasawChileanChineseChippewaChoctawColombianColvilleComancheCosta RicanCreeCreekCroatianCrowCubanCypriotCzechCzechoslovakianDanishDelawareDominicanDutchDutch West IndianEastern EuropeanEcuadorianEgyptianEnglishEstonianEthiopianEuropeanFijianFilipinoFinnishFrenchFrench American IndianFrench CanadianGermanGerman RussianGhanaianGreekGuamanian/ChamorroGuatemalanGuyaneseHaitianHmongHonduranHopiHoumaHungarianIcelanderIndian (Asian)IndonesianInupiatIranianIraqiIrishIroquoisIsraeliItalianJamaicanJapaneseJordanianKenyanKiowaKoreanLaotianLatvianLebaneseLiberianLithuanianLumbeeLuxembourgerMacedonianMalaysianMalteseMarshalleseMenomineeMexicanMexican American IndianMongolianMoroccanNative HawaiianNavajoNepaleseNew ZealanderNicaraguanNigerianNorthern EuropeanNorwegianOkinawanOsageOttawaPaiutePakistaniPalestinianPanamanianParaguayanPennsylvania GermanPeruvianPimaPolishPortuguesePotawatomiPuebloPuerto RicanPuget Sound SalishRomanianRussianSalvadoranSamoanScandinavianScotch-IrishScottishSeminoleSenegaleseSerbianShoshoneSierra LeoneanSiouxSlavicSlovakSloveneSomaliSouth AfricanSouth AmericanSouth American IndianSoviet UnionSpaniardSpanishSpanish AmericanSpanish American IndianSri LankanSubsaharan AfricanSudaneseSwedishSwissSyrianTaiwaneseThaiTlingit-HaidaTohono O'OdhamTonganTrinidadian and TobagonianTsimshianTurkishU.S. Virgin IslanderUgandanUkrainianUruguayanUteVenezuelanVietnameseWelshWest IndianYakamaYaquiYugoslavianYumanYup'ikZimbabwean
Immigration
ImmigrantsAfghanistanAfricaAlbaniaArgentinaArmeniaAsiaAustraliaAustriaBahamasBangladeshBarbadosBelarusBelgiumBelizeBoliviaBosnia and HerzegovinaBrazilBulgariaBurma/MyanmarCabo VerdeCambodiaCameroonCanadaCaribbeanCentral AmericaChileChinaColombiaCongoCosta RicaCroatiaCubaCzechoslovakiaDenmarkDominicaDominican RepublicEastern AfricaEastern AsiaEastern EuropeEcuadorEgyptEl SalvadorEnglandEritreaEthiopiaEuropeFijiFranceGermanyGhanaGreeceGrenadaGuatemalaGuyanaHaitiHondurasHong KongHungaryIndiaIndonesiaIranIraqIrelandIsraelItalyJamaicaJapanJordanKazakhstanKenyaKoreaKuwaitLaosLatin AmericaLatviaLebanonLiberiaLithuaniaMalaysiaMexicoMicronesiaMiddle AfricaMoldovaMoroccoNepalNetherlandsNicaraguaNigeriaNorth AmericaNorth MacedoniaNorthern AfricaNorthern EuropeNorwayOceaniaPakistanPanamaPeruPhilippinesPolandPortugalRomaniaRussiaSaudi ArabiaScotlandSenegalSerbiaSierra LeoneSingaporeSomaliaSouth AfricaSouth AmericaSouth Central AsiaSouth Eastern AsiaSouthern EuropeSpainSri LankaSt. Vincent and the GrenadinesSudanSwedenSwitzerlandSyriaTaiwanThailandTrinidad and TobagoTurkeyUgandaUkraineUruguayUzbekistanVenezuelaVietnamWest IndiesWestern AfricaWestern AsiaWestern EuropeYemenZaireZimbabweAzores
Disability Age 18 to 34
Income
Poverty
Unemployment
Labor Participation
Family Structure
Vehicle Availability
Education Level
Disability

Disability Age 18 to 34 Comparison

Nonimmigrants

Immigrants from Belgium

Tragic
Excellent
7.6%
DISABILITY AGE 18 TO 34
0.0/ 100
METRIC RATING
289th/ 347
METRIC RANK
6.4%
DISABILITY AGE 18 TO 34
83.5/ 100
METRIC RATING
148th/ 347
METRIC RANK

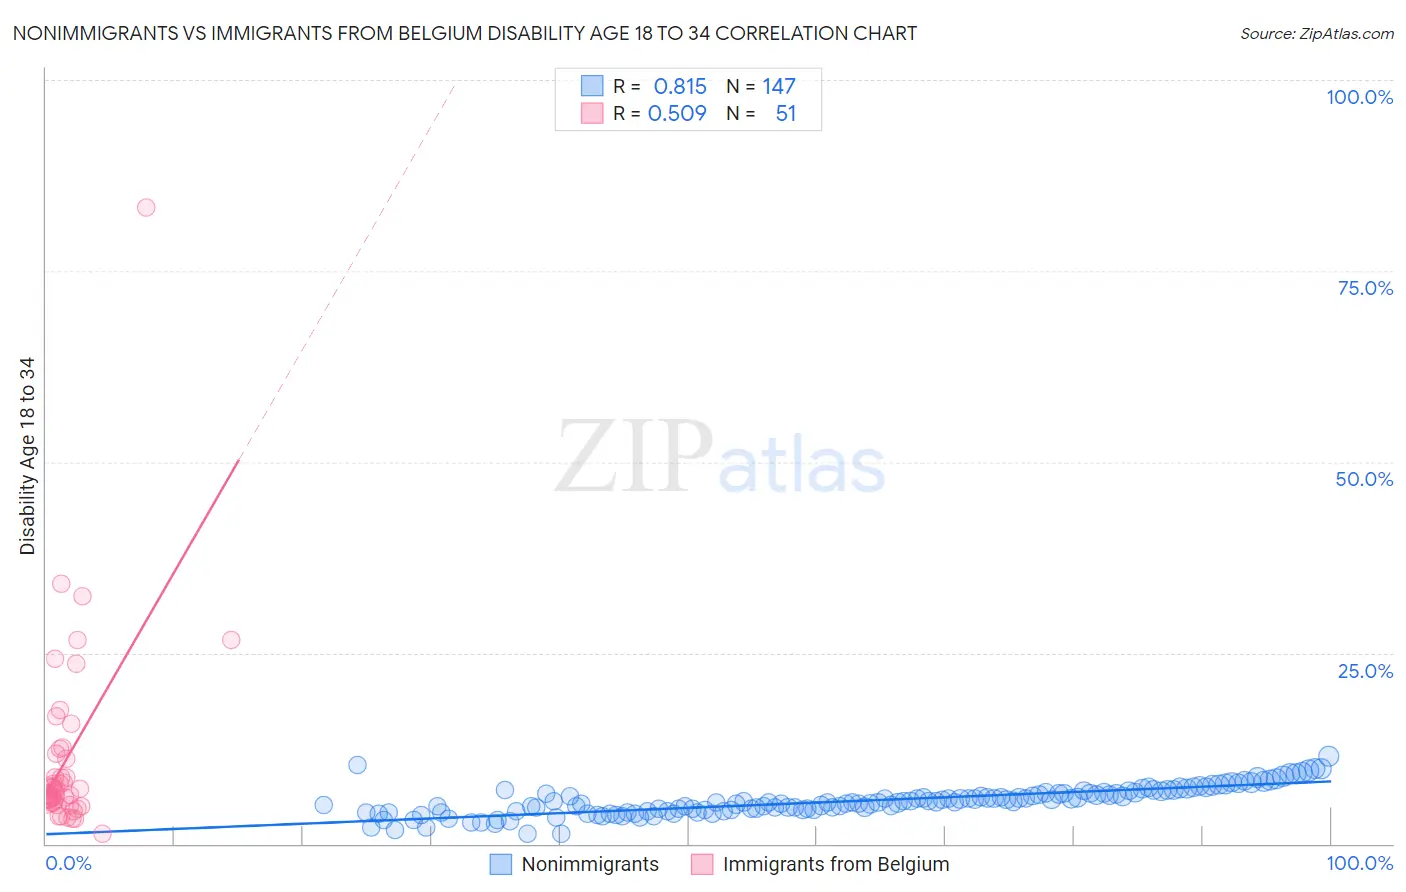
Nonimmigrants vs Immigrants from Belgium Disability Age 18 to 34 Correlation Chart

The statistical analysis conducted on geographies consisting of 576,503,719 people shows a very strong positive correlation between the proportion of Nonimmigrants and percentage of population with a disability between the ages 18 and 35 in the United States with a correlation coefficient (R) of 0.815 and weighted average of 7.6%. Similarly, the statistical analysis conducted on geographies consisting of 146,565,744 people shows a substantial positive correlation between the proportion of Immigrants from Belgium and percentage of population with a disability between the ages 18 and 35 in the United States with a correlation coefficient (R) of 0.509 and weighted average of 6.4%, a difference of 19.2%.
Nonimmigrants vs Immigrants from Belgium Disability Age 18 to 34

Disability Age 18 to 34 Correlation Summary

MeasurementNonimmigrantsImmigrants from Belgium
Minimum1.3%1.3%
Maximum11.5%83.3%
Range10.2%82.1%
Mean5.6%11.1%
Median5.5%6.5%
Interquartile 25% (IQ1)4.4%5.4%
Interquartile 75% (IQ3)6.6%11.7%
Interquartile Range (IQR)2.2%6.3%
Standard Deviation (Sample)1.8%12.8%
Standard Deviation (Population)1.8%12.7%

Similar Demographics by Disability Age 18 to 34

Demographics Similar to Nonimmigrants by Disability Age 18 to 34

In terms of disability age 18 to 34, the demographic groups most similar to Nonimmigrants are Slovak (7.7%, a difference of 0.090%), White/Caucasian (7.6%, a difference of 0.12%), Irish (7.7%, a difference of 0.13%), Norwegian (7.6%, a difference of 0.21%), and Black/African American (7.7%, a difference of 0.36%).
DemographicsRating | RankDisability Age 18 to 34
Spanish
0.0
/100
|
#282
Tragic
7.5%
Danes
0.0
/100
|
#283
Tragic
7.5%
Hopi
0.0
/100
|
#284
Tragic
7.5%
Swedes
0.0
/100
|
#285
Tragic
7.5%
Celtics
0.0
/100
|
#286
Tragic
7.6%
Norwegians
0.0
/100
|
#287
Tragic
7.6%
Whites/Caucasians
0.0
/100
|
#288
Tragic
7.6%
Immigrants | Nonimmigrants
0.0
/100
|
#289
Tragic
7.6%
Slovaks
0.0
/100
|
#290
Tragic
7.7%
Irish
0.0
/100
|
#291
Tragic
7.7%
Blacks/African Americans
0.0
/100
|
#292
Tragic
7.7%
Scandinavians
0.0
/100
|
#293
Tragic
7.7%
Immigrants | Cabo Verde
0.0
/100
|
#294
Tragic
7.7%
Tlingit-Haida
0.0
/100
|
#295
Tragic
7.7%
Cape Verdeans
0.0
/100
|
#296
Tragic
7.7%

Demographics Similar to Immigrants from Belgium by Disability Age 18 to 34

In terms of disability age 18 to 34, the demographic groups most similar to Immigrants from Belgium are Immigrants from South Africa (6.4%, a difference of 0.020%), Honduran (6.4%, a difference of 0.060%), Immigrants from Dominican Republic (6.4%, a difference of 0.10%), Belizean (6.4%, a difference of 0.18%), and Tongan (6.4%, a difference of 0.21%).
DemographicsRating | RankDisability Age 18 to 34
Jamaicans
86.8
/100
|
#141
Excellent
6.4%
South American Indians
86.5
/100
|
#142
Excellent
6.4%
Immigrants | Latvia
86.4
/100
|
#143
Excellent
6.4%
Albanians
85.3
/100
|
#144
Excellent
6.4%
Moroccans
85.2
/100
|
#145
Excellent
6.4%
Belizeans
84.9
/100
|
#146
Excellent
6.4%
Immigrants | South Africa
83.7
/100
|
#147
Excellent
6.4%
Immigrants | Belgium
83.5
/100
|
#148
Excellent
6.4%
Hondurans
83.1
/100
|
#149
Excellent
6.4%
Immigrants | Dominican Republic
82.7
/100
|
#150
Excellent
6.4%
Tongans
81.9
/100
|
#151
Excellent
6.4%
Bulgarians
78.3
/100
|
#152
Good
6.5%
Immigrants | Eritrea
77.4
/100
|
#153
Good
6.5%
Immigrants | Central America
76.8
/100
|
#154
Good
6.5%
Inupiat
76.7
/100
|
#155
Good
6.5%