Nonimmigrants vs Guyanese Disability Age 18 to 34
COMPARE
Nonimmigrants
Guyanese
Disability Age 18 to 34
Disability Age 18 to 34 Comparison
Nonimmigrants
Guyanese
7.6%
DISABILITY AGE 18 TO 34
0.0/ 100
METRIC RATING
289th/ 347
METRIC RANK
5.5%
DISABILITY AGE 18 TO 34
100.0/ 100
METRIC RATING
9th/ 347
METRIC RANK
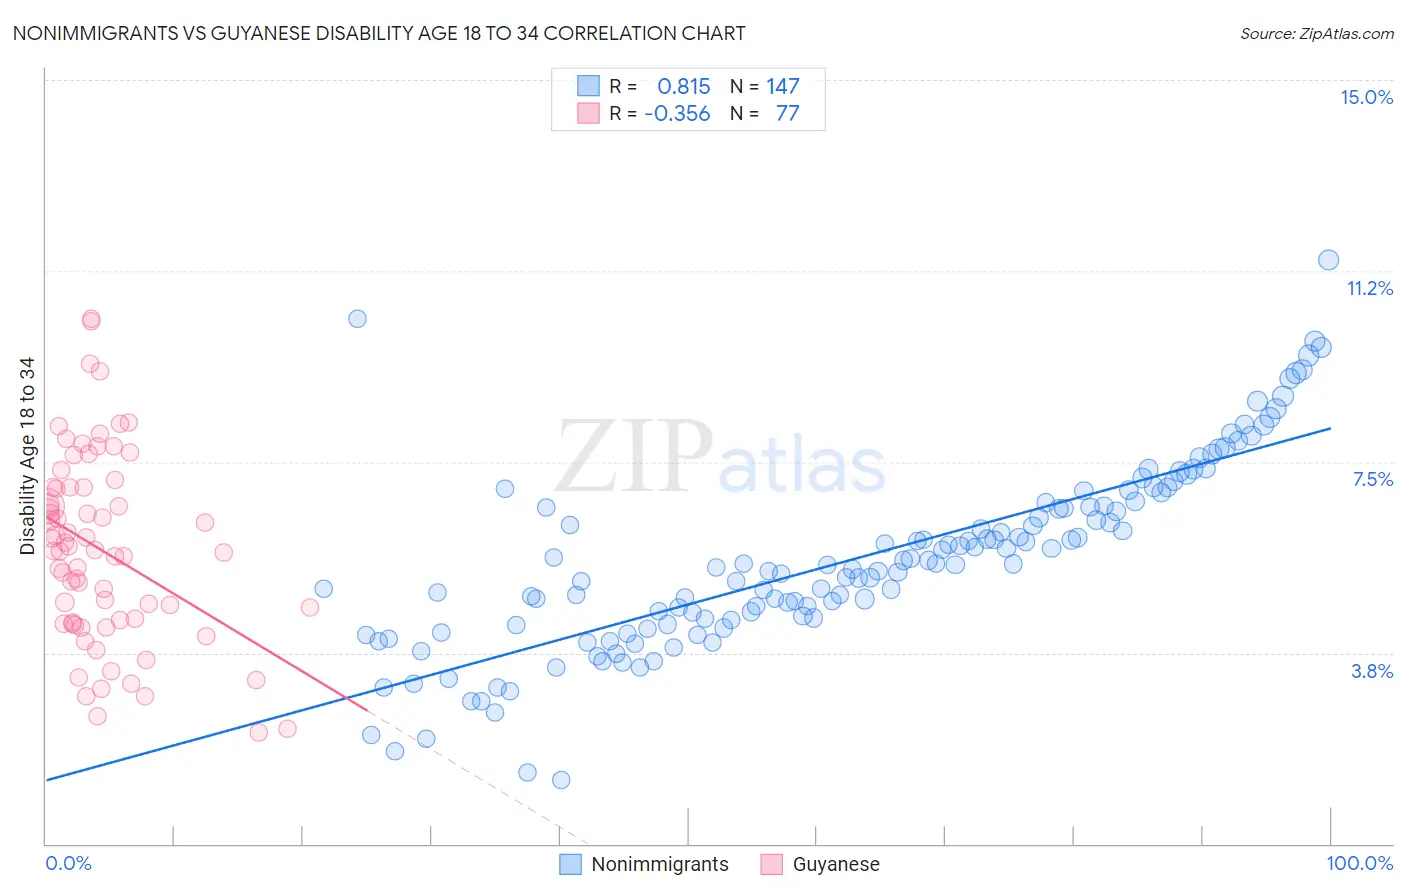
Nonimmigrants vs Guyanese Disability Age 18 to 34 Correlation Chart
The statistical analysis conducted on geographies consisting of 576,503,719 people shows a very strong positive correlation between the proportion of Nonimmigrants and percentage of population with a disability between the ages 18 and 35 in the United States with a correlation coefficient (R) of 0.815 and weighted average of 7.6%. Similarly, the statistical analysis conducted on geographies consisting of 176,786,761 people shows a mild negative correlation between the proportion of Guyanese and percentage of population with a disability between the ages 18 and 35 in the United States with a correlation coefficient (R) of -0.356 and weighted average of 5.5%, a difference of 38.8%.
Disability Age 18 to 34 Correlation Summary
| Measurement | Nonimmigrants | Guyanese |
| Minimum | 1.3% | 2.2% |
| Maximum | 11.5% | 10.3% |
| Range | 10.2% | 8.1% |
| Mean | 5.6% | 5.8% |
| Median | 5.5% | 5.8% |
| Interquartile 25% (IQ1) | 4.4% | 4.3% |
| Interquartile 75% (IQ3) | 6.6% | 7.0% |
| Interquartile Range (IQR) | 2.2% | 2.6% |
| Standard Deviation (Sample) | 1.8% | 1.8% |
| Standard Deviation (Population) | 1.8% | 1.8% |
Similar Demographics by Disability Age 18 to 34
Demographics Similar to Nonimmigrants by Disability Age 18 to 34
In terms of disability age 18 to 34, the demographic groups most similar to Nonimmigrants are Slovak (7.7%, a difference of 0.090%), White/Caucasian (7.6%, a difference of 0.12%), Irish (7.7%, a difference of 0.13%), Norwegian (7.6%, a difference of 0.21%), and Black/African American (7.7%, a difference of 0.36%).
| Demographics | Rating | Rank | Disability Age 18 to 34 |
| Spanish | 0.0 /100 | #282 | Tragic 7.5% |
| Danes | 0.0 /100 | #283 | Tragic 7.5% |
| Hopi | 0.0 /100 | #284 | Tragic 7.5% |
| Swedes | 0.0 /100 | #285 | Tragic 7.5% |
| Celtics | 0.0 /100 | #286 | Tragic 7.6% |
| Norwegians | 0.0 /100 | #287 | Tragic 7.6% |
| Whites/Caucasians | 0.0 /100 | #288 | Tragic 7.6% |
| Immigrants | Nonimmigrants | 0.0 /100 | #289 | Tragic 7.6% |
| Slovaks | 0.0 /100 | #290 | Tragic 7.7% |
| Irish | 0.0 /100 | #291 | Tragic 7.7% |
| Blacks/African Americans | 0.0 /100 | #292 | Tragic 7.7% |
| Scandinavians | 0.0 /100 | #293 | Tragic 7.7% |
| Immigrants | Cabo Verde | 0.0 /100 | #294 | Tragic 7.7% |
| Tlingit-Haida | 0.0 /100 | #295 | Tragic 7.7% |
| Cape Verdeans | 0.0 /100 | #296 | Tragic 7.7% |
Demographics Similar to Guyanese by Disability Age 18 to 34
In terms of disability age 18 to 34, the demographic groups most similar to Guyanese are Immigrants from Uzbekistan (5.5%, a difference of 0.15%), Vietnamese (5.5%, a difference of 0.22%), Immigrants from St. Vincent and the Grenadines (5.5%, a difference of 0.28%), Immigrants from Guyana (5.5%, a difference of 0.50%), and Immigrants from Iran (5.5%, a difference of 0.60%).
| Demographics | Rating | Rank | Disability Age 18 to 34 |
| Immigrants | Hong Kong | 100.0 /100 | #2 | Exceptional 5.2% |
| Immigrants | Grenada | 100.0 /100 | #3 | Exceptional 5.3% |
| Immigrants | Cuba | 100.0 /100 | #4 | Exceptional 5.4% |
| Immigrants | Taiwan | 100.0 /100 | #5 | Exceptional 5.4% |
| Filipinos | 100.0 /100 | #6 | Exceptional 5.4% |
| Immigrants | China | 100.0 /100 | #7 | Exceptional 5.4% |
| Immigrants | Guyana | 100.0 /100 | #8 | Exceptional 5.5% |
| Guyanese | 100.0 /100 | #9 | Exceptional 5.5% |
| Immigrants | Uzbekistan | 100.0 /100 | #10 | Exceptional 5.5% |
| Vietnamese | 100.0 /100 | #11 | Exceptional 5.5% |
| Immigrants | St. Vincent and the Grenadines | 100.0 /100 | #12 | Exceptional 5.5% |
| Immigrants | Iran | 100.0 /100 | #13 | Exceptional 5.5% |
| Indians (Asian) | 100.0 /100 | #14 | Exceptional 5.5% |
| Immigrants | India | 100.0 /100 | #15 | Exceptional 5.6% |
| Immigrants | Israel | 100.0 /100 | #16 | Exceptional 5.6% |