Immigrants from West Indies vs European Cognitive Disability
COMPARE
Immigrants from West Indies
European
Cognitive Disability
Cognitive Disability Comparison
Immigrants from West Indies
Europeans
18.1%
COGNITIVE DISABILITY
0.1/ 100
METRIC RATING
288th/ 347
METRIC RANK
17.0%
COGNITIVE DISABILITY
93.4/ 100
METRIC RATING
126th/ 347
METRIC RANK
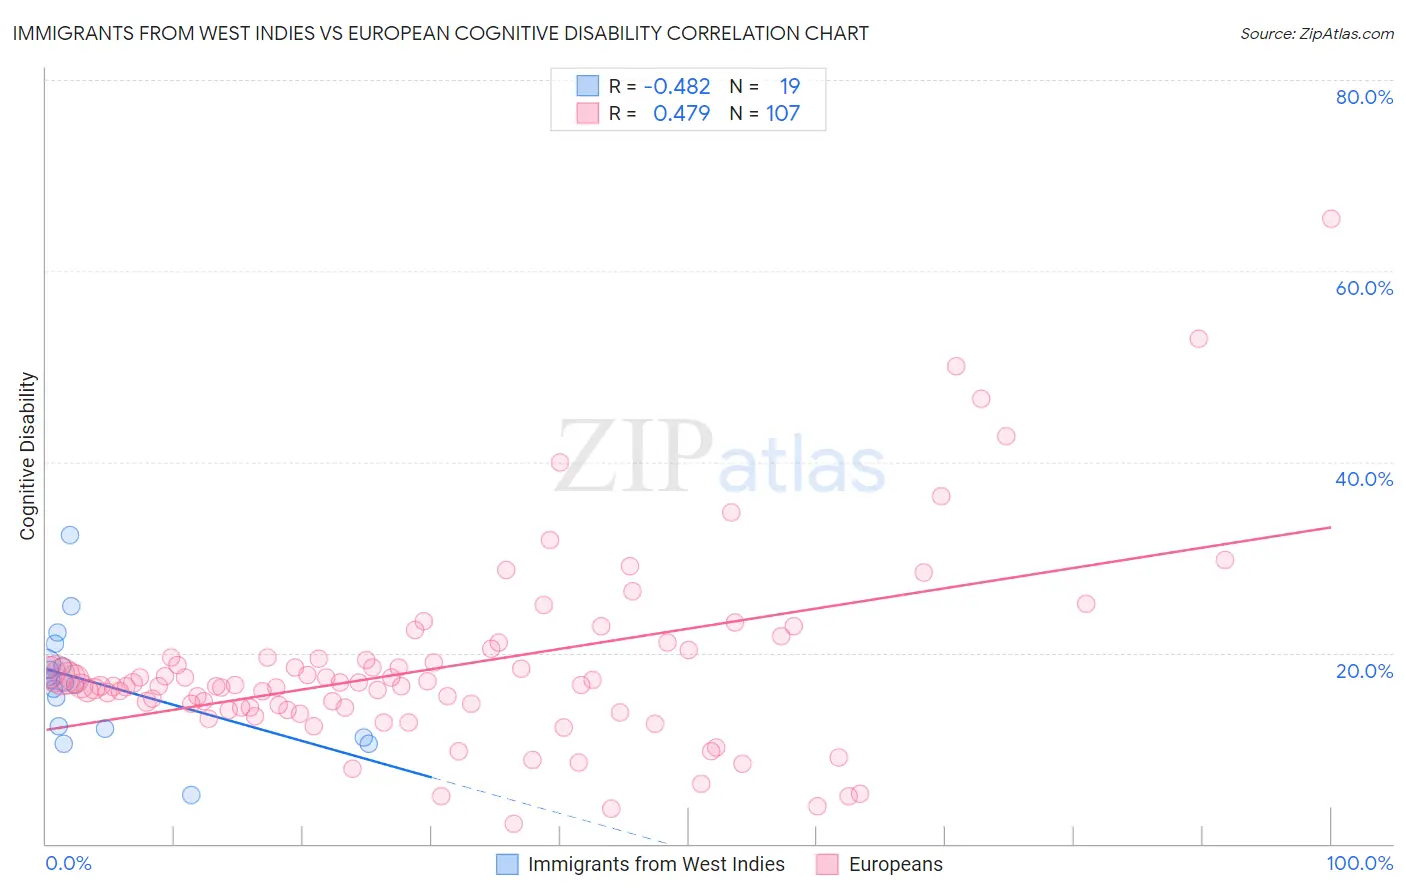
Immigrants from West Indies vs European Cognitive Disability Correlation Chart
The statistical analysis conducted on geographies consisting of 72,456,461 people shows a moderate negative correlation between the proportion of Immigrants from West Indies and percentage of population with cognitive disability in the United States with a correlation coefficient (R) of -0.482 and weighted average of 18.1%. Similarly, the statistical analysis conducted on geographies consisting of 561,683,346 people shows a moderate positive correlation between the proportion of Europeans and percentage of population with cognitive disability in the United States with a correlation coefficient (R) of 0.479 and weighted average of 17.0%, a difference of 7.0%.
Cognitive Disability Correlation Summary
| Measurement | Immigrants from West Indies | European |
| Minimum | 5.0% | 2.1% |
| Maximum | 32.4% | 65.5% |
| Range | 27.4% | 63.4% |
| Mean | 16.7% | 18.5% |
| Median | 16.9% | 16.6% |
| Interquartile 25% (IQ1) | 12.1% | 14.2% |
| Interquartile 75% (IQ3) | 18.8% | 19.6% |
| Interquartile Range (IQR) | 6.8% | 5.3% |
| Standard Deviation (Sample) | 6.0% | 9.9% |
| Standard Deviation (Population) | 5.9% | 9.9% |
Similar Demographics by Cognitive Disability
Demographics Similar to Immigrants from West Indies by Cognitive Disability
In terms of cognitive disability, the demographic groups most similar to Immigrants from West Indies are Dutch West Indian (18.1%, a difference of 0.010%), Native/Alaskan (18.1%, a difference of 0.010%), Immigrants from Africa (18.1%, a difference of 0.040%), Kenyan (18.1%, a difference of 0.050%), and Bermudan (18.1%, a difference of 0.090%).
| Demographics | Rating | Rank | Cognitive Disability |
| Yakama | 0.1 /100 | #281 | Tragic 18.1% |
| Immigrants | Cambodia | 0.1 /100 | #282 | Tragic 18.1% |
| Nigerians | 0.1 /100 | #283 | Tragic 18.1% |
| Immigrants | Uganda | 0.1 /100 | #284 | Tragic 18.1% |
| Bermudans | 0.1 /100 | #285 | Tragic 18.1% |
| Kenyans | 0.1 /100 | #286 | Tragic 18.1% |
| Dutch West Indians | 0.1 /100 | #287 | Tragic 18.1% |
| Immigrants | West Indies | 0.1 /100 | #288 | Tragic 18.1% |
| Natives/Alaskans | 0.1 /100 | #289 | Tragic 18.1% |
| Immigrants | Africa | 0.1 /100 | #290 | Tragic 18.1% |
| Ottawa | 0.1 /100 | #291 | Tragic 18.2% |
| Iroquois | 0.1 /100 | #292 | Tragic 18.2% |
| Central American Indians | 0.1 /100 | #293 | Tragic 18.2% |
| British West Indians | 0.1 /100 | #294 | Tragic 18.2% |
| German Russians | 0.0 /100 | #295 | Tragic 18.2% |
Demographics Similar to Europeans by Cognitive Disability
In terms of cognitive disability, the demographic groups most similar to Europeans are Immigrants from Costa Rica (17.0%, a difference of 0.040%), Nicaraguan (17.0%, a difference of 0.050%), Immigrants from Uruguay (17.0%, a difference of 0.060%), Scandinavian (16.9%, a difference of 0.090%), and Immigrants from Vietnam (17.0%, a difference of 0.12%).
| Demographics | Rating | Rank | Cognitive Disability |
| South Africans | 95.5 /100 | #119 | Exceptional 16.9% |
| Scottish | 95.0 /100 | #120 | Exceptional 16.9% |
| Immigrants | China | 94.9 /100 | #121 | Exceptional 16.9% |
| Immigrants | Western Europe | 94.8 /100 | #122 | Exceptional 16.9% |
| Portuguese | 94.7 /100 | #123 | Exceptional 16.9% |
| Turks | 94.5 /100 | #124 | Exceptional 16.9% |
| Scandinavians | 94.1 /100 | #125 | Exceptional 16.9% |
| Europeans | 93.4 /100 | #126 | Exceptional 17.0% |
| Immigrants | Costa Rica | 93.1 /100 | #127 | Exceptional 17.0% |
| Nicaraguans | 93.0 /100 | #128 | Exceptional 17.0% |
| Immigrants | Uruguay | 92.9 /100 | #129 | Exceptional 17.0% |
| Immigrants | Vietnam | 92.4 /100 | #130 | Exceptional 17.0% |
| Immigrants | Germany | 92.1 /100 | #131 | Exceptional 17.0% |
| Whites/Caucasians | 92.1 /100 | #132 | Exceptional 17.0% |
| Immigrants | Jordan | 91.9 /100 | #133 | Exceptional 17.0% |