Nicaraguan vs Immigrants from Singapore Disability Age Over 75
COMPARE
Nicaraguan
Immigrants from Singapore
Disability Age Over 75
Disability Age Over 75 Comparison
Nicaraguans
Immigrants from Singapore
48.3%
DISABILITY AGE OVER 75
3.0/ 100
METRIC RATING
238th/ 347
METRIC RANK
45.6%
DISABILITY AGE OVER 75
99.8/ 100
METRIC RATING
41st/ 347
METRIC RANK
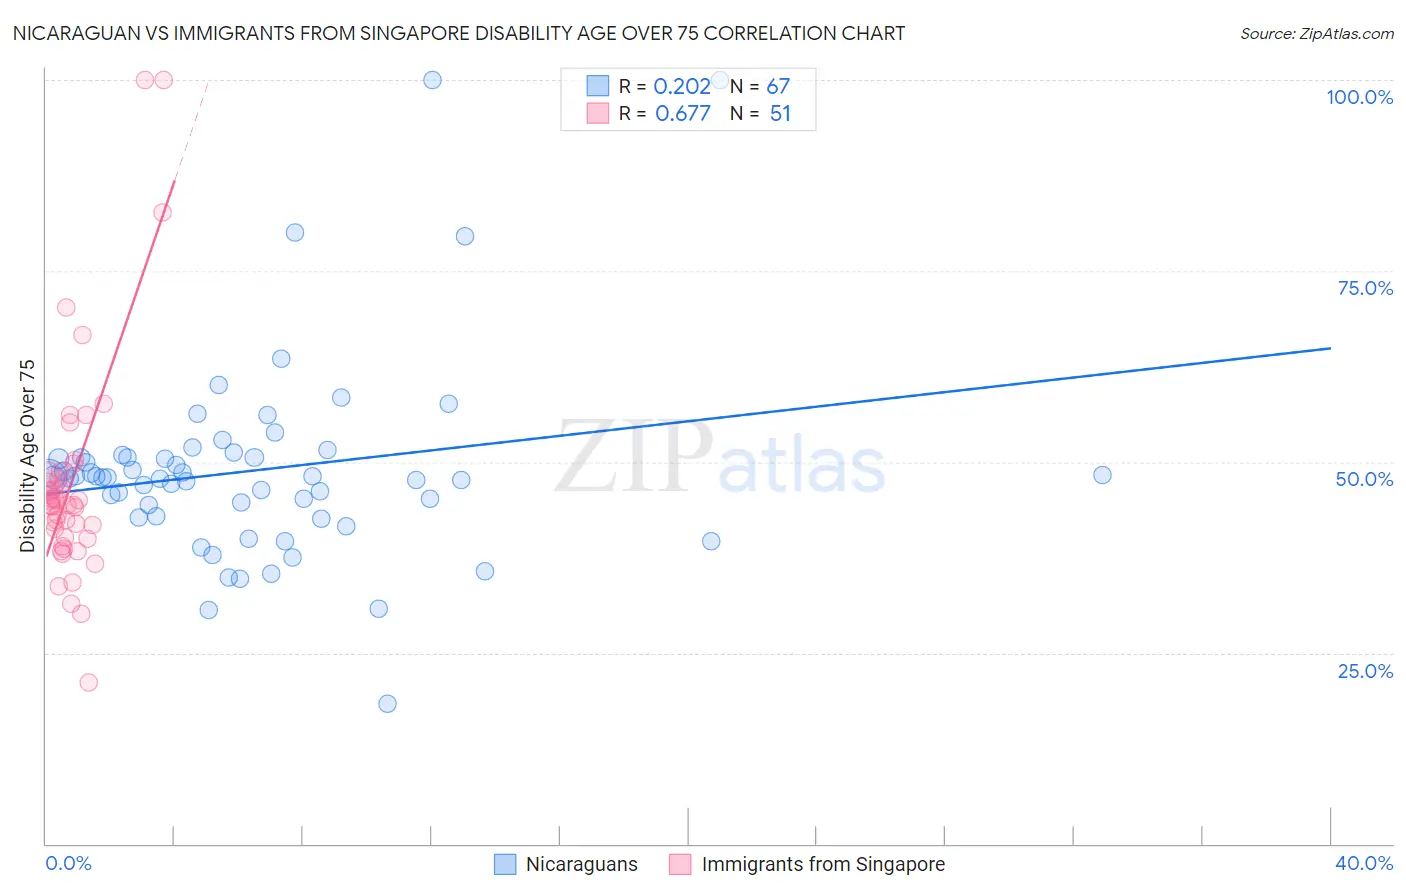
Nicaraguan vs Immigrants from Singapore Disability Age Over 75 Correlation Chart
The statistical analysis conducted on geographies consisting of 285,291,775 people shows a weak positive correlation between the proportion of Nicaraguans and percentage of population with a disability over the age of 75 in the United States with a correlation coefficient (R) of 0.202 and weighted average of 48.3%. Similarly, the statistical analysis conducted on geographies consisting of 137,364,760 people shows a significant positive correlation between the proportion of Immigrants from Singapore and percentage of population with a disability over the age of 75 in the United States with a correlation coefficient (R) of 0.677 and weighted average of 45.6%, a difference of 5.8%.
Disability Age Over 75 Correlation Summary
| Measurement | Nicaraguan | Immigrants from Singapore |
| Minimum | 18.3% | 21.2% |
| Maximum | 100.0% | 100.0% |
| Range | 81.7% | 78.8% |
| Mean | 48.9% | 47.3% |
| Median | 47.9% | 44.5% |
| Interquartile 25% (IQ1) | 42.8% | 40.1% |
| Interquartile 75% (IQ3) | 50.6% | 48.4% |
| Interquartile Range (IQR) | 7.8% | 8.3% |
| Standard Deviation (Sample) | 13.0% | 14.5% |
| Standard Deviation (Population) | 12.9% | 14.4% |
Similar Demographics by Disability Age Over 75
Demographics Similar to Nicaraguans by Disability Age Over 75
In terms of disability age over 75, the demographic groups most similar to Nicaraguans are Immigrants from Nicaragua (48.2%, a difference of 0.030%), Immigrants from St. Vincent and the Grenadines (48.2%, a difference of 0.030%), Immigrants from Thailand (48.3%, a difference of 0.040%), Subsaharan African (48.2%, a difference of 0.13%), and Hmong (48.2%, a difference of 0.13%).
| Demographics | Rating | Rank | Disability Age Over 75 |
| Immigrants | Immigrants | 4.3 /100 | #231 | Tragic 48.2% |
| Indonesians | 4.2 /100 | #232 | Tragic 48.2% |
| Cree | 4.2 /100 | #233 | Tragic 48.2% |
| Sub-Saharan Africans | 3.8 /100 | #234 | Tragic 48.2% |
| Hmong | 3.8 /100 | #235 | Tragic 48.2% |
| Immigrants | Nicaragua | 3.2 /100 | #236 | Tragic 48.2% |
| Immigrants | St. Vincent and the Grenadines | 3.2 /100 | #237 | Tragic 48.2% |
| Nicaraguans | 3.0 /100 | #238 | Tragic 48.3% |
| Immigrants | Thailand | 2.8 /100 | #239 | Tragic 48.3% |
| Tongans | 2.3 /100 | #240 | Tragic 48.3% |
| Native Hawaiians | 2.2 /100 | #241 | Tragic 48.3% |
| French American Indians | 2.2 /100 | #242 | Tragic 48.3% |
| Immigrants | Caribbean | 2.1 /100 | #243 | Tragic 48.4% |
| Afghans | 1.8 /100 | #244 | Tragic 48.4% |
| Americans | 1.7 /100 | #245 | Tragic 48.4% |
Demographics Similar to Immigrants from Singapore by Disability Age Over 75
In terms of disability age over 75, the demographic groups most similar to Immigrants from Singapore are Slovene (45.6%, a difference of 0.030%), Greek (45.6%, a difference of 0.040%), Czech (45.7%, a difference of 0.050%), Estonian (45.6%, a difference of 0.090%), and Australian (45.7%, a difference of 0.090%).
| Demographics | Rating | Rank | Disability Age Over 75 |
| Russians | 99.9 /100 | #34 | Exceptional 45.5% |
| Norwegians | 99.9 /100 | #35 | Exceptional 45.5% |
| Immigrants | Taiwan | 99.9 /100 | #36 | Exceptional 45.5% |
| South Africans | 99.9 /100 | #37 | Exceptional 45.5% |
| Italians | 99.9 /100 | #38 | Exceptional 45.6% |
| Estonians | 99.9 /100 | #39 | Exceptional 45.6% |
| Slovenes | 99.9 /100 | #40 | Exceptional 45.6% |
| Immigrants | Singapore | 99.8 /100 | #41 | Exceptional 45.6% |
| Greeks | 99.8 /100 | #42 | Exceptional 45.6% |
| Czechs | 99.8 /100 | #43 | Exceptional 45.7% |
| Australians | 99.8 /100 | #44 | Exceptional 45.7% |
| Turks | 99.8 /100 | #45 | Exceptional 45.7% |
| Swedes | 99.8 /100 | #46 | Exceptional 45.7% |
| Immigrants | Canada | 99.8 /100 | #47 | Exceptional 45.7% |
| Croatians | 99.8 /100 | #48 | Exceptional 45.7% |