Nepalese vs Burmese Disability Age Over 75
COMPARE
Nepalese
Burmese
Disability Age Over 75
Disability Age Over 75 Comparison
Nepalese
Burmese
52.6%
DISABILITY AGE OVER 75
0.0/ 100
METRIC RATING
327th/ 347
METRIC RANK
45.9%
DISABILITY AGE OVER 75
99.5/ 100
METRIC RATING
62nd/ 347
METRIC RANK
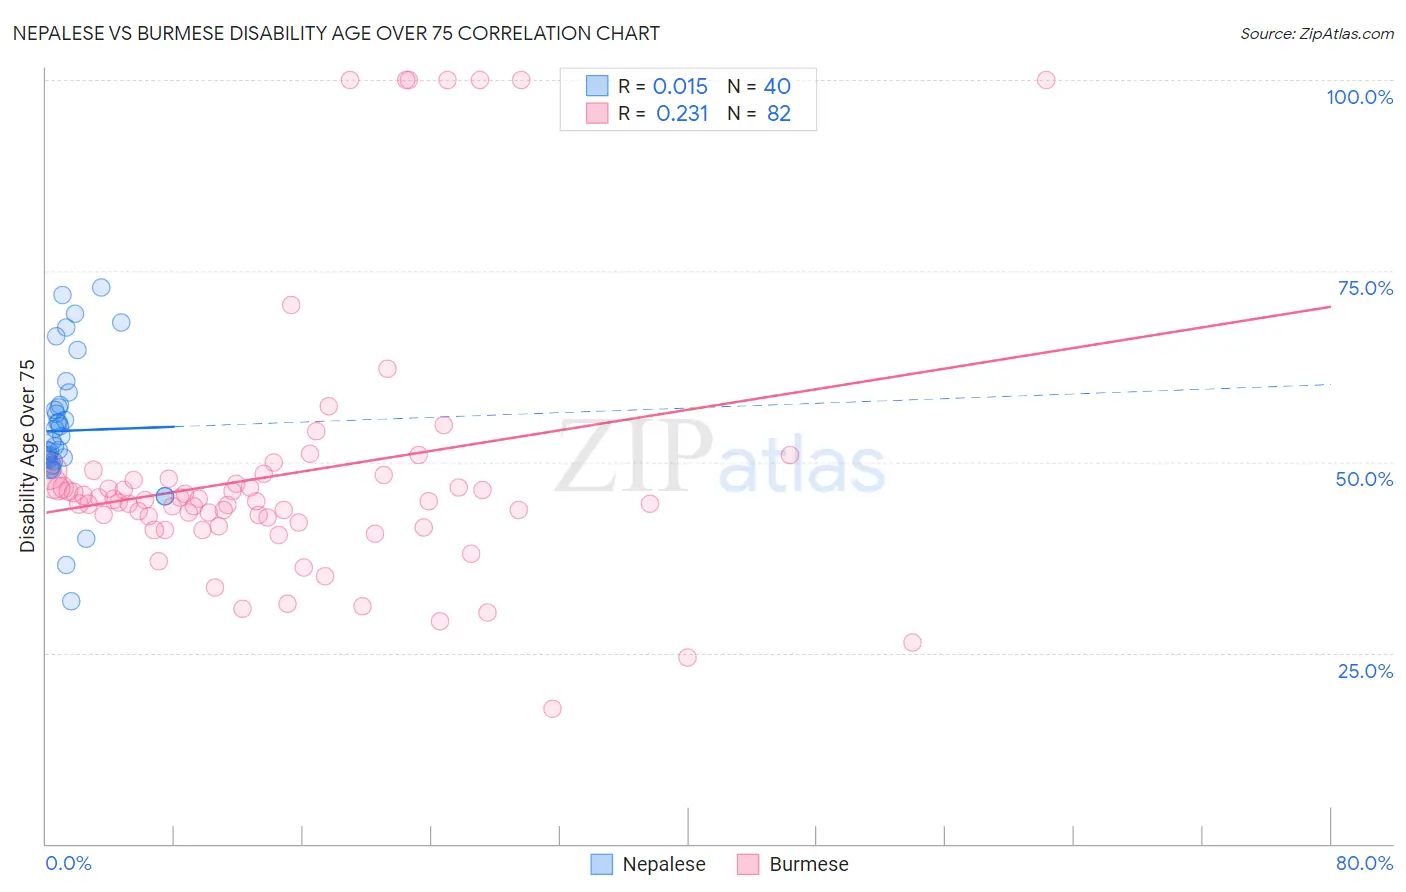
Nepalese vs Burmese Disability Age Over 75 Correlation Chart
The statistical analysis conducted on geographies consisting of 24,521,755 people shows no correlation between the proportion of Nepalese and percentage of population with a disability over the age of 75 in the United States with a correlation coefficient (R) of 0.015 and weighted average of 52.6%. Similarly, the statistical analysis conducted on geographies consisting of 463,970,259 people shows a weak positive correlation between the proportion of Burmese and percentage of population with a disability over the age of 75 in the United States with a correlation coefficient (R) of 0.231 and weighted average of 45.9%, a difference of 14.5%.
Disability Age Over 75 Correlation Summary
| Measurement | Nepalese | Burmese |
| Minimum | 31.7% | 17.7% |
| Maximum | 72.9% | 100.0% |
| Range | 41.1% | 82.3% |
| Mean | 54.1% | 48.5% |
| Median | 52.3% | 44.9% |
| Interquartile 25% (IQ1) | 49.8% | 42.1% |
| Interquartile 75% (IQ3) | 57.3% | 47.8% |
| Interquartile Range (IQR) | 7.5% | 5.7% |
| Standard Deviation (Sample) | 8.8% | 17.5% |
| Standard Deviation (Population) | 8.7% | 17.4% |
Similar Demographics by Disability Age Over 75
Demographics Similar to Nepalese by Disability Age Over 75
In terms of disability age over 75, the demographic groups most similar to Nepalese are Ute (52.6%, a difference of 0.030%), Choctaw (52.7%, a difference of 0.19%), Immigrants from Cabo Verde (52.4%, a difference of 0.38%), Alaska Native (52.8%, a difference of 0.41%), and Menominee (52.3%, a difference of 0.54%).
| Demographics | Rating | Rank | Disability Age Over 75 |
| Paiute | 0.0 /100 | #320 | Tragic 51.5% |
| Dutch West Indians | 0.0 /100 | #321 | Tragic 51.5% |
| Comanche | 0.0 /100 | #322 | Tragic 51.7% |
| Immigrants | Yemen | 0.0 /100 | #323 | Tragic 52.0% |
| Menominee | 0.0 /100 | #324 | Tragic 52.3% |
| Immigrants | Cabo Verde | 0.0 /100 | #325 | Tragic 52.4% |
| Ute | 0.0 /100 | #326 | Tragic 52.6% |
| Nepalese | 0.0 /100 | #327 | Tragic 52.6% |
| Choctaw | 0.0 /100 | #328 | Tragic 52.7% |
| Alaska Natives | 0.0 /100 | #329 | Tragic 52.8% |
| Puerto Ricans | 0.0 /100 | #330 | Tragic 52.9% |
| Hopi | 0.0 /100 | #331 | Tragic 52.9% |
| Natives/Alaskans | 0.0 /100 | #332 | Tragic 53.1% |
| Apache | 0.0 /100 | #333 | Tragic 53.6% |
| Alaskan Athabascans | 0.0 /100 | #334 | Tragic 54.0% |
Demographics Similar to Burmese by Disability Age Over 75
In terms of disability age over 75, the demographic groups most similar to Burmese are Immigrants from Argentina (45.9%, a difference of 0.030%), Iranian (45.9%, a difference of 0.050%), Immigrants from Europe (45.9%, a difference of 0.050%), Immigrants from Norway (45.9%, a difference of 0.050%), and Immigrants from North Macedonia (45.9%, a difference of 0.050%).
| Demographics | Rating | Rank | Disability Age Over 75 |
| Maltese | 99.6 /100 | #55 | Exceptional 45.8% |
| Immigrants | Netherlands | 99.6 /100 | #56 | Exceptional 45.9% |
| Immigrants | Turkey | 99.6 /100 | #57 | Exceptional 45.9% |
| Immigrants | Israel | 99.6 /100 | #58 | Exceptional 45.9% |
| Iranians | 99.6 /100 | #59 | Exceptional 45.9% |
| Immigrants | Europe | 99.6 /100 | #60 | Exceptional 45.9% |
| Immigrants | Argentina | 99.6 /100 | #61 | Exceptional 45.9% |
| Burmese | 99.5 /100 | #62 | Exceptional 45.9% |
| Immigrants | Norway | 99.5 /100 | #63 | Exceptional 45.9% |
| Immigrants | North Macedonia | 99.5 /100 | #64 | Exceptional 45.9% |
| Austrians | 99.5 /100 | #65 | Exceptional 46.0% |
| Immigrants | England | 99.5 /100 | #66 | Exceptional 46.0% |
| Immigrants | Spain | 99.4 /100 | #67 | Exceptional 46.0% |
| Immigrants | South Central Asia | 99.4 /100 | #68 | Exceptional 46.0% |
| Immigrants | Romania | 99.3 /100 | #69 | Exceptional 46.0% |