Nepalese vs Syrian Ambulatory Disability
COMPARE
Nepalese
Syrian
Ambulatory Disability
Ambulatory Disability Comparison
Nepalese
Syrians
6.6%
AMBULATORY DISABILITY
0.2/ 100
METRIC RATING
264th/ 347
METRIC RANK
6.0%
AMBULATORY DISABILITY
75.5/ 100
METRIC RATING
153rd/ 347
METRIC RANK
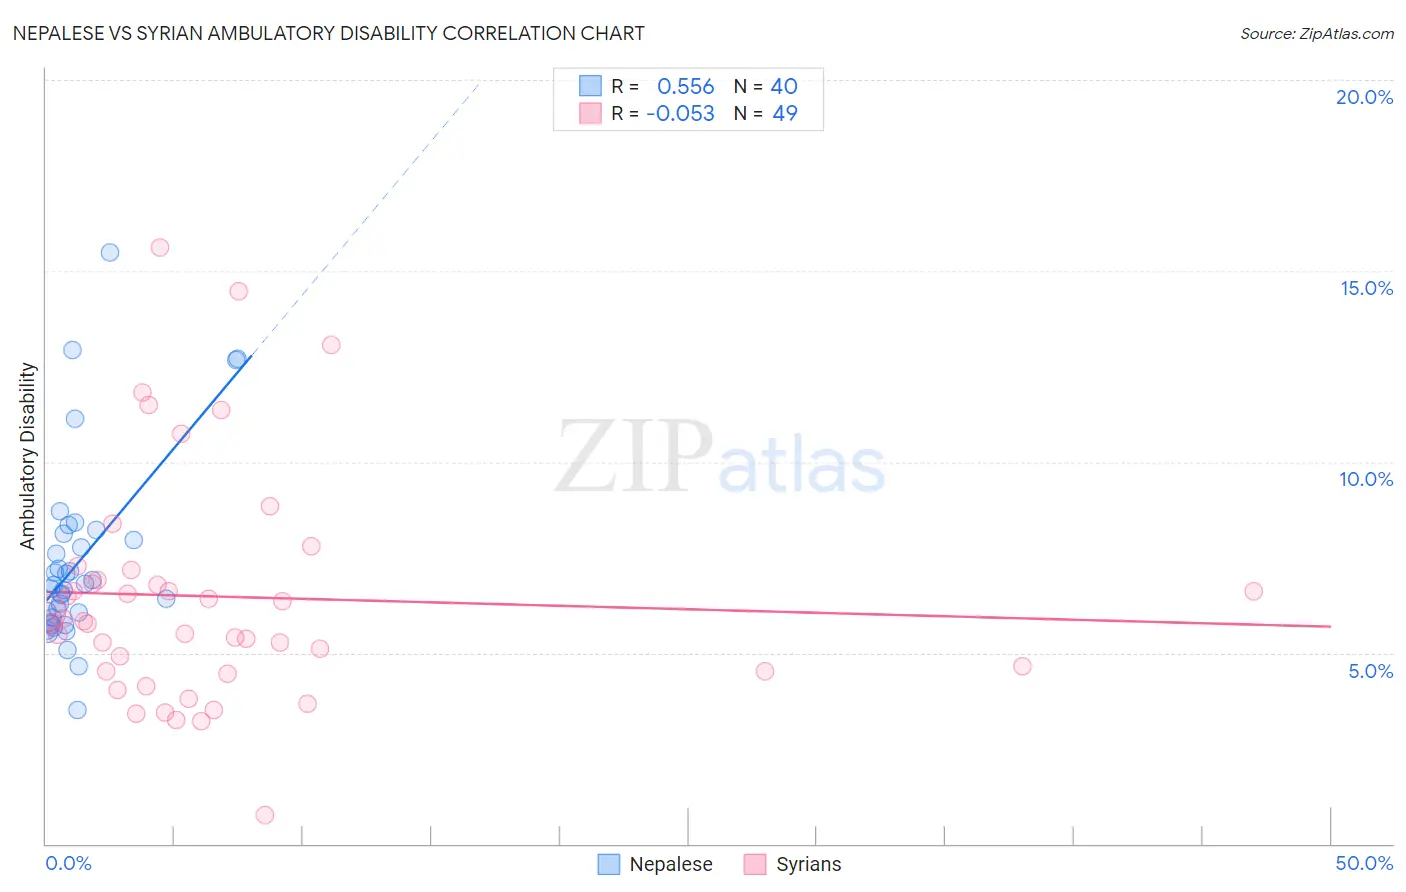
Nepalese vs Syrian Ambulatory Disability Correlation Chart
The statistical analysis conducted on geographies consisting of 24,521,755 people shows a substantial positive correlation between the proportion of Nepalese and percentage of population with ambulatory disability in the United States with a correlation coefficient (R) of 0.556 and weighted average of 6.6%. Similarly, the statistical analysis conducted on geographies consisting of 266,278,347 people shows a slight negative correlation between the proportion of Syrians and percentage of population with ambulatory disability in the United States with a correlation coefficient (R) of -0.053 and weighted average of 6.0%, a difference of 9.6%.
Ambulatory Disability Correlation Summary
| Measurement | Nepalese | Syrian |
| Minimum | 3.5% | 0.77% |
| Maximum | 15.5% | 15.6% |
| Range | 12.0% | 14.8% |
| Mean | 7.4% | 6.5% |
| Median | 6.7% | 5.8% |
| Interquartile 25% (IQ1) | 5.9% | 4.5% |
| Interquartile 75% (IQ3) | 8.0% | 7.0% |
| Interquartile Range (IQR) | 2.2% | 2.5% |
| Standard Deviation (Sample) | 2.4% | 3.0% |
| Standard Deviation (Population) | 2.4% | 3.0% |
Similar Demographics by Ambulatory Disability
Demographics Similar to Nepalese by Ambulatory Disability
In terms of ambulatory disability, the demographic groups most similar to Nepalese are Bahamian (6.6%, a difference of 0.060%), Guyanese (6.6%, a difference of 0.18%), Trinidadian and Tobagonian (6.6%, a difference of 0.31%), Spanish (6.6%, a difference of 0.33%), and Hmong (6.6%, a difference of 0.40%).
| Demographics | Rating | Rank | Ambulatory Disability |
| Bermudans | 0.5 /100 | #257 | Tragic 6.5% |
| Spanish American Indians | 0.5 /100 | #258 | Tragic 6.5% |
| Aleuts | 0.4 /100 | #259 | Tragic 6.6% |
| Immigrants | Belize | 0.4 /100 | #260 | Tragic 6.6% |
| Irish | 0.4 /100 | #261 | Tragic 6.6% |
| English | 0.4 /100 | #262 | Tragic 6.6% |
| Hmong | 0.3 /100 | #263 | Tragic 6.6% |
| Nepalese | 0.2 /100 | #264 | Tragic 6.6% |
| Bahamians | 0.2 /100 | #265 | Tragic 6.6% |
| Guyanese | 0.2 /100 | #266 | Tragic 6.6% |
| Trinidadians and Tobagonians | 0.2 /100 | #267 | Tragic 6.6% |
| Spanish | 0.2 /100 | #268 | Tragic 6.6% |
| French | 0.1 /100 | #269 | Tragic 6.6% |
| Slovaks | 0.1 /100 | #270 | Tragic 6.7% |
| Immigrants | Trinidad and Tobago | 0.1 /100 | #271 | Tragic 6.7% |
Demographics Similar to Syrians by Ambulatory Disability
In terms of ambulatory disability, the demographic groups most similar to Syrians are Immigrants from Croatia (6.0%, a difference of 0.030%), Immigrants from Scotland (6.0%, a difference of 0.23%), Immigrants from Austria (6.0%, a difference of 0.25%), Northern European (6.0%, a difference of 0.25%), and Ghanaian (6.0%, a difference of 0.29%).
| Demographics | Rating | Rank | Ambulatory Disability |
| Immigrants | Greece | 82.5 /100 | #146 | Excellent 6.0% |
| Immigrants | Moldova | 82.4 /100 | #147 | Excellent 6.0% |
| Immigrants | Eastern Europe | 82.0 /100 | #148 | Excellent 6.0% |
| Lithuanians | 81.9 /100 | #149 | Excellent 6.0% |
| Maltese | 81.6 /100 | #150 | Excellent 6.0% |
| Greeks | 79.6 /100 | #151 | Good 6.0% |
| Immigrants | Austria | 78.8 /100 | #152 | Good 6.0% |
| Syrians | 75.5 /100 | #153 | Good 6.0% |
| Immigrants | Croatia | 75.1 /100 | #154 | Good 6.0% |
| Immigrants | Scotland | 72.1 /100 | #155 | Good 6.0% |
| Northern Europeans | 71.8 /100 | #156 | Good 6.0% |
| Ghanaians | 71.3 /100 | #157 | Good 6.0% |
| Immigrants | Fiji | 71.2 /100 | #158 | Good 6.0% |
| Immigrants | Latvia | 71.1 /100 | #159 | Good 6.0% |
| Central Americans | 69.8 /100 | #160 | Good 6.0% |