Nepalese vs Immigrants from Saudi Arabia Ambulatory Disability
COMPARE
Nepalese
Immigrants from Saudi Arabia
Ambulatory Disability
Ambulatory Disability Comparison
Nepalese
Immigrants from Saudi Arabia
6.6%
AMBULATORY DISABILITY
0.2/ 100
METRIC RATING
264th/ 347
METRIC RANK
5.4%
AMBULATORY DISABILITY
100.0/ 100
METRIC RATING
24th/ 347
METRIC RANK
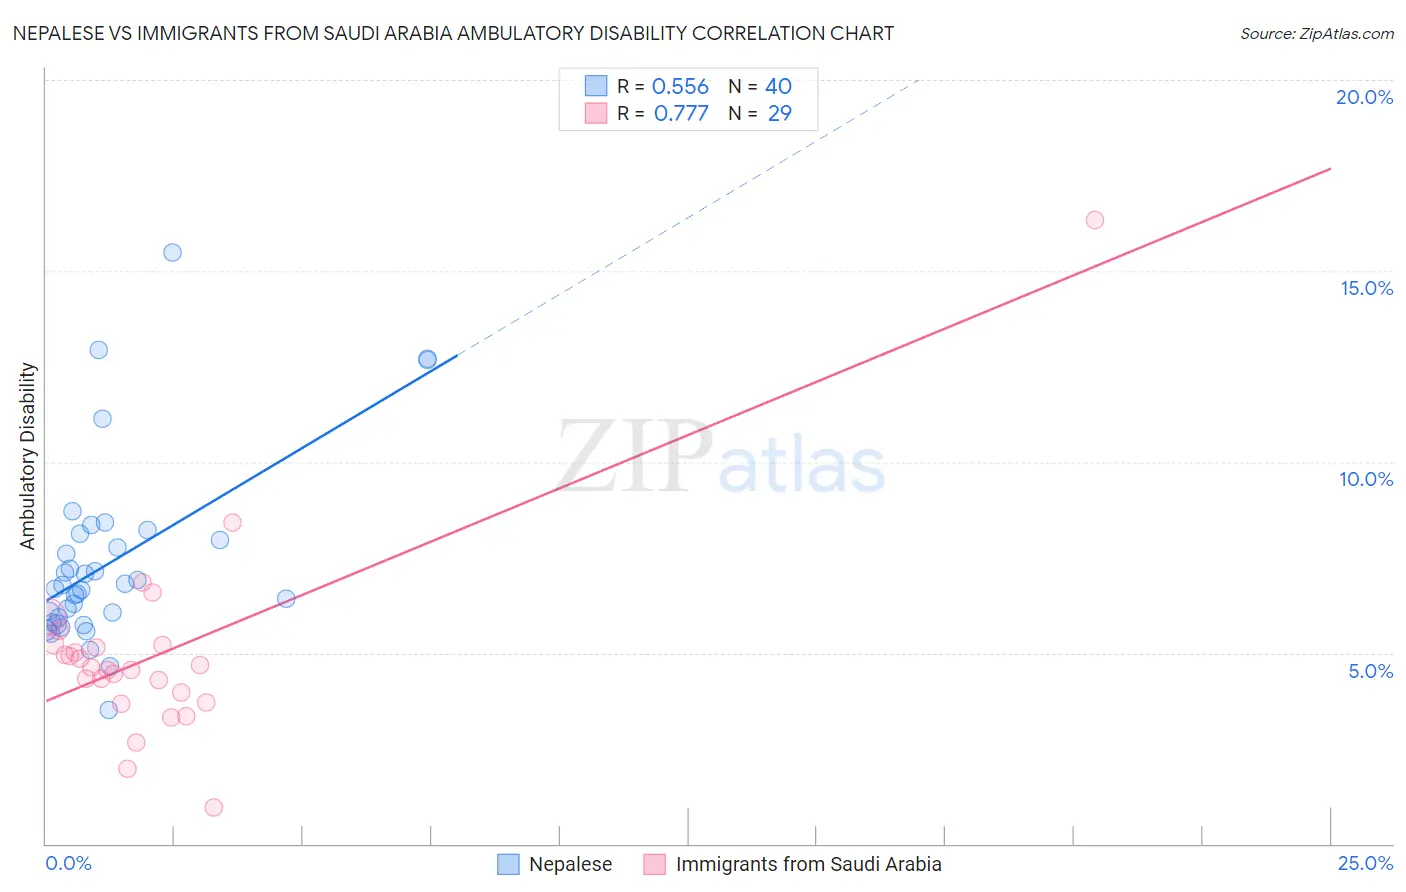
Nepalese vs Immigrants from Saudi Arabia Ambulatory Disability Correlation Chart
The statistical analysis conducted on geographies consisting of 24,521,755 people shows a substantial positive correlation between the proportion of Nepalese and percentage of population with ambulatory disability in the United States with a correlation coefficient (R) of 0.556 and weighted average of 6.6%. Similarly, the statistical analysis conducted on geographies consisting of 164,275,583 people shows a strong positive correlation between the proportion of Immigrants from Saudi Arabia and percentage of population with ambulatory disability in the United States with a correlation coefficient (R) of 0.777 and weighted average of 5.4%, a difference of 22.6%.
Ambulatory Disability Correlation Summary
| Measurement | Nepalese | Immigrants from Saudi Arabia |
| Minimum | 3.5% | 0.94% |
| Maximum | 15.5% | 16.3% |
| Range | 12.0% | 15.4% |
| Mean | 7.4% | 5.0% |
| Median | 6.7% | 4.6% |
| Interquartile 25% (IQ1) | 5.9% | 3.8% |
| Interquartile 75% (IQ3) | 8.0% | 5.2% |
| Interquartile Range (IQR) | 2.2% | 1.4% |
| Standard Deviation (Sample) | 2.4% | 2.6% |
| Standard Deviation (Population) | 2.4% | 2.6% |
Similar Demographics by Ambulatory Disability
Demographics Similar to Nepalese by Ambulatory Disability
In terms of ambulatory disability, the demographic groups most similar to Nepalese are Bahamian (6.6%, a difference of 0.060%), Guyanese (6.6%, a difference of 0.18%), Trinidadian and Tobagonian (6.6%, a difference of 0.31%), Spanish (6.6%, a difference of 0.33%), and Hmong (6.6%, a difference of 0.40%).
| Demographics | Rating | Rank | Ambulatory Disability |
| Bermudans | 0.5 /100 | #257 | Tragic 6.5% |
| Spanish American Indians | 0.5 /100 | #258 | Tragic 6.5% |
| Aleuts | 0.4 /100 | #259 | Tragic 6.6% |
| Immigrants | Belize | 0.4 /100 | #260 | Tragic 6.6% |
| Irish | 0.4 /100 | #261 | Tragic 6.6% |
| English | 0.4 /100 | #262 | Tragic 6.6% |
| Hmong | 0.3 /100 | #263 | Tragic 6.6% |
| Nepalese | 0.2 /100 | #264 | Tragic 6.6% |
| Bahamians | 0.2 /100 | #265 | Tragic 6.6% |
| Guyanese | 0.2 /100 | #266 | Tragic 6.6% |
| Trinidadians and Tobagonians | 0.2 /100 | #267 | Tragic 6.6% |
| Spanish | 0.2 /100 | #268 | Tragic 6.6% |
| French | 0.1 /100 | #269 | Tragic 6.6% |
| Slovaks | 0.1 /100 | #270 | Tragic 6.7% |
| Immigrants | Trinidad and Tobago | 0.1 /100 | #271 | Tragic 6.7% |
Demographics Similar to Immigrants from Saudi Arabia by Ambulatory Disability
In terms of ambulatory disability, the demographic groups most similar to Immigrants from Saudi Arabia are Zimbabwean (5.4%, a difference of 0.080%), Tongan (5.4%, a difference of 0.090%), Immigrants from Nepal (5.4%, a difference of 0.11%), Immigrants from Israel (5.4%, a difference of 0.13%), and Asian (5.4%, a difference of 0.27%).
| Demographics | Rating | Rank | Ambulatory Disability |
| Immigrants | Ethiopia | 100.0 /100 | #17 | Exceptional 5.4% |
| Immigrants | Sri Lanka | 100.0 /100 | #18 | Exceptional 5.4% |
| Indians (Asian) | 100.0 /100 | #19 | Exceptional 5.4% |
| Ethiopians | 100.0 /100 | #20 | Exceptional 5.4% |
| Immigrants | Kuwait | 100.0 /100 | #21 | Exceptional 5.4% |
| Immigrants | Israel | 100.0 /100 | #22 | Exceptional 5.4% |
| Tongans | 100.0 /100 | #23 | Exceptional 5.4% |
| Immigrants | Saudi Arabia | 100.0 /100 | #24 | Exceptional 5.4% |
| Zimbabweans | 100.0 /100 | #25 | Exceptional 5.4% |
| Immigrants | Nepal | 100.0 /100 | #26 | Exceptional 5.4% |
| Asians | 100.0 /100 | #27 | Exceptional 5.4% |
| Cambodians | 100.0 /100 | #28 | Exceptional 5.4% |
| Immigrants | Iran | 100.0 /100 | #29 | Exceptional 5.4% |
| Immigrants | Turkey | 100.0 /100 | #30 | Exceptional 5.4% |
| Immigrants | Venezuela | 100.0 /100 | #31 | Exceptional 5.4% |