Navajo vs Immigrants from Liberia Cognitive Disability
COMPARE
Navajo
Immigrants from Liberia
Cognitive Disability
Cognitive Disability Comparison
Navajo
Immigrants from Liberia
18.8%
COGNITIVE DISABILITY
0.0/ 100
METRIC RATING
329th/ 347
METRIC RANK
18.7%
COGNITIVE DISABILITY
0.0/ 100
METRIC RATING
322nd/ 347
METRIC RANK
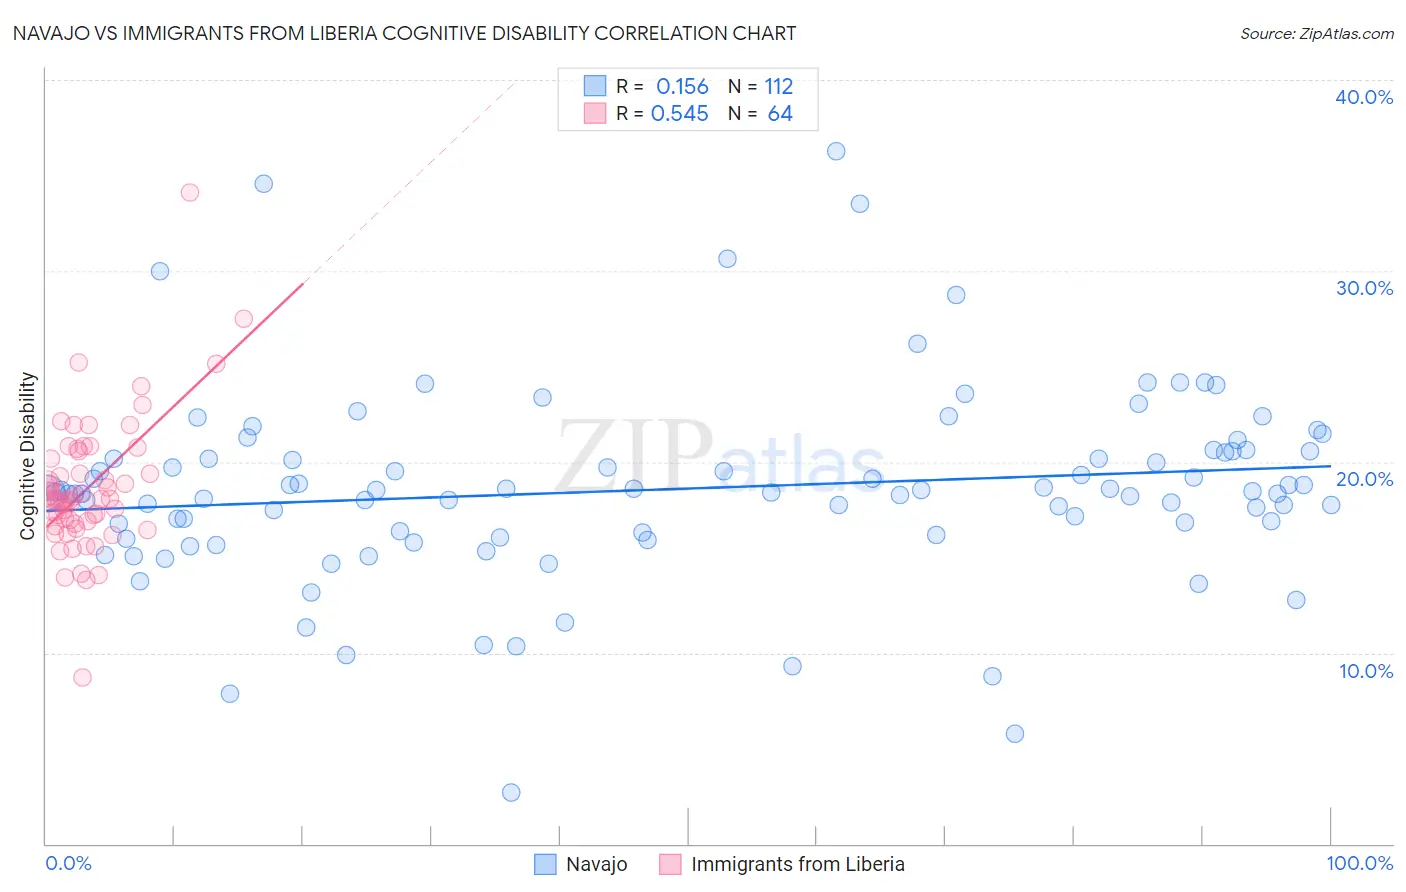
Navajo vs Immigrants from Liberia Cognitive Disability Correlation Chart
The statistical analysis conducted on geographies consisting of 224,779,988 people shows a poor positive correlation between the proportion of Navajo and percentage of population with cognitive disability in the United States with a correlation coefficient (R) of 0.156 and weighted average of 18.8%. Similarly, the statistical analysis conducted on geographies consisting of 135,261,320 people shows a substantial positive correlation between the proportion of Immigrants from Liberia and percentage of population with cognitive disability in the United States with a correlation coefficient (R) of 0.545 and weighted average of 18.7%, a difference of 0.56%.
Cognitive Disability Correlation Summary
| Measurement | Navajo | Immigrants from Liberia |
| Minimum | 2.7% | 8.7% |
| Maximum | 36.3% | 34.1% |
| Range | 33.6% | 25.4% |
| Mean | 18.6% | 18.7% |
| Median | 18.4% | 18.0% |
| Interquartile 25% (IQ1) | 16.2% | 16.8% |
| Interquartile 75% (IQ3) | 20.5% | 20.4% |
| Interquartile Range (IQR) | 4.3% | 3.6% |
| Standard Deviation (Sample) | 5.1% | 3.6% |
| Standard Deviation (Population) | 5.1% | 3.6% |
Demographics Similar to Navajo and Immigrants from Liberia by Cognitive Disability
In terms of cognitive disability, the demographic groups most similar to Navajo are Immigrants from Dominican Republic (18.8%, a difference of 0.10%), Pima (18.8%, a difference of 0.16%), Immigrants from Sudan (18.8%, a difference of 0.18%), Kiowa (18.7%, a difference of 0.22%), and Immigrants from Yemen (18.8%, a difference of 0.24%). Similarly, the demographic groups most similar to Immigrants from Liberia are Pueblo (18.7%, a difference of 0.020%), African (18.6%, a difference of 0.060%), Dominican (18.7%, a difference of 0.14%), Apache (18.6%, a difference of 0.16%), and Comanche (18.6%, a difference of 0.19%).
| Demographics | Rating | Rank | Cognitive Disability |
| Immigrants | Dominica | 0.0 /100 | #315 | Tragic 18.6% |
| Immigrants | Middle Africa | 0.0 /100 | #316 | Tragic 18.6% |
| Liberians | 0.0 /100 | #317 | Tragic 18.6% |
| Bangladeshis | 0.0 /100 | #318 | Tragic 18.6% |
| Comanche | 0.0 /100 | #319 | Tragic 18.6% |
| Apache | 0.0 /100 | #320 | Tragic 18.6% |
| Africans | 0.0 /100 | #321 | Tragic 18.6% |
| Immigrants | Liberia | 0.0 /100 | #322 | Tragic 18.7% |
| Pueblo | 0.0 /100 | #323 | Tragic 18.7% |
| Dominicans | 0.0 /100 | #324 | Tragic 18.7% |
| Indonesians | 0.0 /100 | #325 | Tragic 18.7% |
| Immigrants | Senegal | 0.0 /100 | #326 | Tragic 18.7% |
| U.S. Virgin Islanders | 0.0 /100 | #327 | Tragic 18.7% |
| Kiowa | 0.0 /100 | #328 | Tragic 18.7% |
| Navajo | 0.0 /100 | #329 | Tragic 18.8% |
| Immigrants | Dominican Republic | 0.0 /100 | #330 | Tragic 18.8% |
| Pima | 0.0 /100 | #331 | Tragic 18.8% |
| Immigrants | Sudan | 0.0 /100 | #332 | Tragic 18.8% |
| Immigrants | Yemen | 0.0 /100 | #333 | Tragic 18.8% |
| Sudanese | 0.0 /100 | #334 | Tragic 18.9% |
| Senegalese | 0.0 /100 | #335 | Tragic 19.0% |