Navajo vs English Ambulatory Disability
COMPARE
Navajo
English
Ambulatory Disability
Ambulatory Disability Comparison
Navajo
English
7.5%
AMBULATORY DISABILITY
0.0/ 100
METRIC RATING
324th/ 347
METRIC RANK
6.6%
AMBULATORY DISABILITY
0.4/ 100
METRIC RATING
262nd/ 347
METRIC RANK
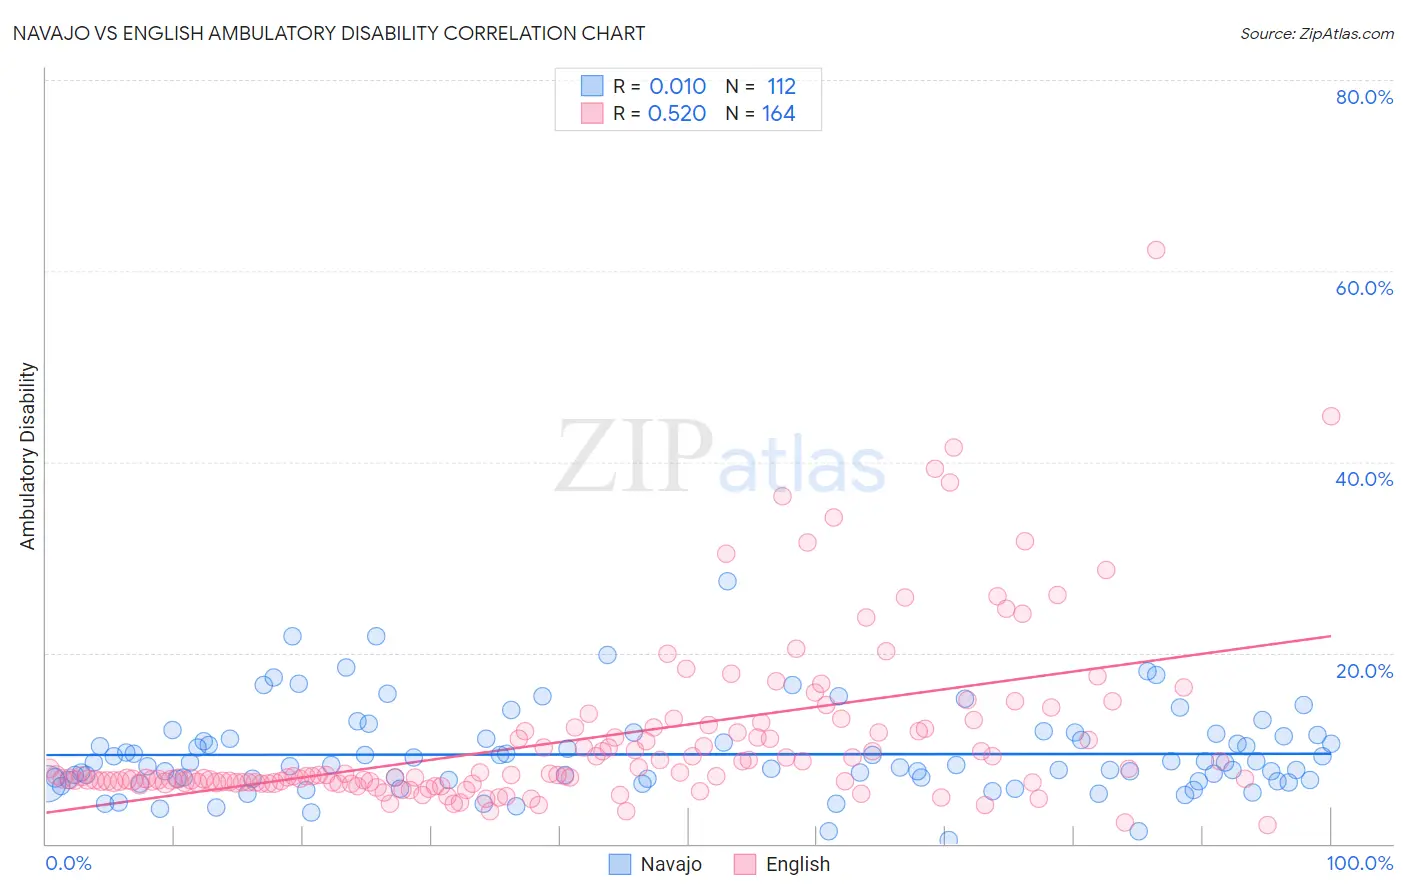
Navajo vs English Ambulatory Disability Correlation Chart
The statistical analysis conducted on geographies consisting of 224,747,889 people shows no correlation between the proportion of Navajo and percentage of population with ambulatory disability in the United States with a correlation coefficient (R) of 0.010 and weighted average of 7.5%. Similarly, the statistical analysis conducted on geographies consisting of 579,179,335 people shows a substantial positive correlation between the proportion of English and percentage of population with ambulatory disability in the United States with a correlation coefficient (R) of 0.520 and weighted average of 6.6%, a difference of 14.2%.
Ambulatory Disability Correlation Summary
| Measurement | Navajo | English |
| Minimum | 0.36% | 2.0% |
| Maximum | 27.6% | 62.2% |
| Range | 27.2% | 60.2% |
| Mean | 9.4% | 11.0% |
| Median | 8.3% | 7.1% |
| Interquartile 25% (IQ1) | 6.7% | 6.4% |
| Interquartile 75% (IQ3) | 11.2% | 11.9% |
| Interquartile Range (IQR) | 4.5% | 5.5% |
| Standard Deviation (Sample) | 4.5% | 9.0% |
| Standard Deviation (Population) | 4.5% | 8.9% |
Similar Demographics by Ambulatory Disability
Demographics Similar to Navajo by Ambulatory Disability
In terms of ambulatory disability, the demographic groups most similar to Navajo are Comanche (7.5%, a difference of 0.070%), Black/African American (7.5%, a difference of 0.18%), Native/Alaskan (7.5%, a difference of 0.20%), Hopi (7.6%, a difference of 1.1%), and Pueblo (7.6%, a difference of 1.2%).
| Demographics | Rating | Rank | Ambulatory Disability |
| Central American Indians | 0.0 /100 | #317 | Tragic 7.2% |
| Ottawa | 0.0 /100 | #318 | Tragic 7.2% |
| Dominicans | 0.0 /100 | #319 | Tragic 7.2% |
| Potawatomi | 0.0 /100 | #320 | Tragic 7.3% |
| Apache | 0.0 /100 | #321 | Tragic 7.4% |
| Osage | 0.0 /100 | #322 | Tragic 7.4% |
| Americans | 0.0 /100 | #323 | Tragic 7.4% |
| Navajo | 0.0 /100 | #324 | Tragic 7.5% |
| Comanche | 0.0 /100 | #325 | Tragic 7.5% |
| Blacks/African Americans | 0.0 /100 | #326 | Tragic 7.5% |
| Natives/Alaskans | 0.0 /100 | #327 | Tragic 7.5% |
| Hopi | 0.0 /100 | #328 | Tragic 7.6% |
| Pueblo | 0.0 /100 | #329 | Tragic 7.6% |
| Paiute | 0.0 /100 | #330 | Tragic 7.7% |
| Cajuns | 0.0 /100 | #331 | Tragic 7.8% |
Demographics Similar to English by Ambulatory Disability
In terms of ambulatory disability, the demographic groups most similar to English are Hmong (6.6%, a difference of 0.12%), Irish (6.6%, a difference of 0.17%), Immigrants from Belize (6.6%, a difference of 0.24%), Aleut (6.6%, a difference of 0.25%), and Spanish American Indian (6.5%, a difference of 0.43%).
| Demographics | Rating | Rank | Ambulatory Disability |
| Welsh | 0.6 /100 | #255 | Tragic 6.5% |
| Immigrants | Uzbekistan | 0.6 /100 | #256 | Tragic 6.5% |
| Bermudans | 0.5 /100 | #257 | Tragic 6.5% |
| Spanish American Indians | 0.5 /100 | #258 | Tragic 6.5% |
| Aleuts | 0.4 /100 | #259 | Tragic 6.6% |
| Immigrants | Belize | 0.4 /100 | #260 | Tragic 6.6% |
| Irish | 0.4 /100 | #261 | Tragic 6.6% |
| English | 0.4 /100 | #262 | Tragic 6.6% |
| Hmong | 0.3 /100 | #263 | Tragic 6.6% |
| Nepalese | 0.2 /100 | #264 | Tragic 6.6% |
| Bahamians | 0.2 /100 | #265 | Tragic 6.6% |
| Guyanese | 0.2 /100 | #266 | Tragic 6.6% |
| Trinidadians and Tobagonians | 0.2 /100 | #267 | Tragic 6.6% |
| Spanish | 0.2 /100 | #268 | Tragic 6.6% |
| French | 0.1 /100 | #269 | Tragic 6.6% |