Tongan vs Latvian Self-Care Disability
COMPARE
Tongan
Latvian
Self-Care Disability
Self-Care Disability Comparison
Tongans
Latvians
2.2%
SELF-CARE DISABILITY
100.0/ 100
METRIC RATING
20th/ 347
METRIC RANK
2.3%
SELF-CARE DISABILITY
99.7/ 100
METRIC RATING
49th/ 347
METRIC RANK
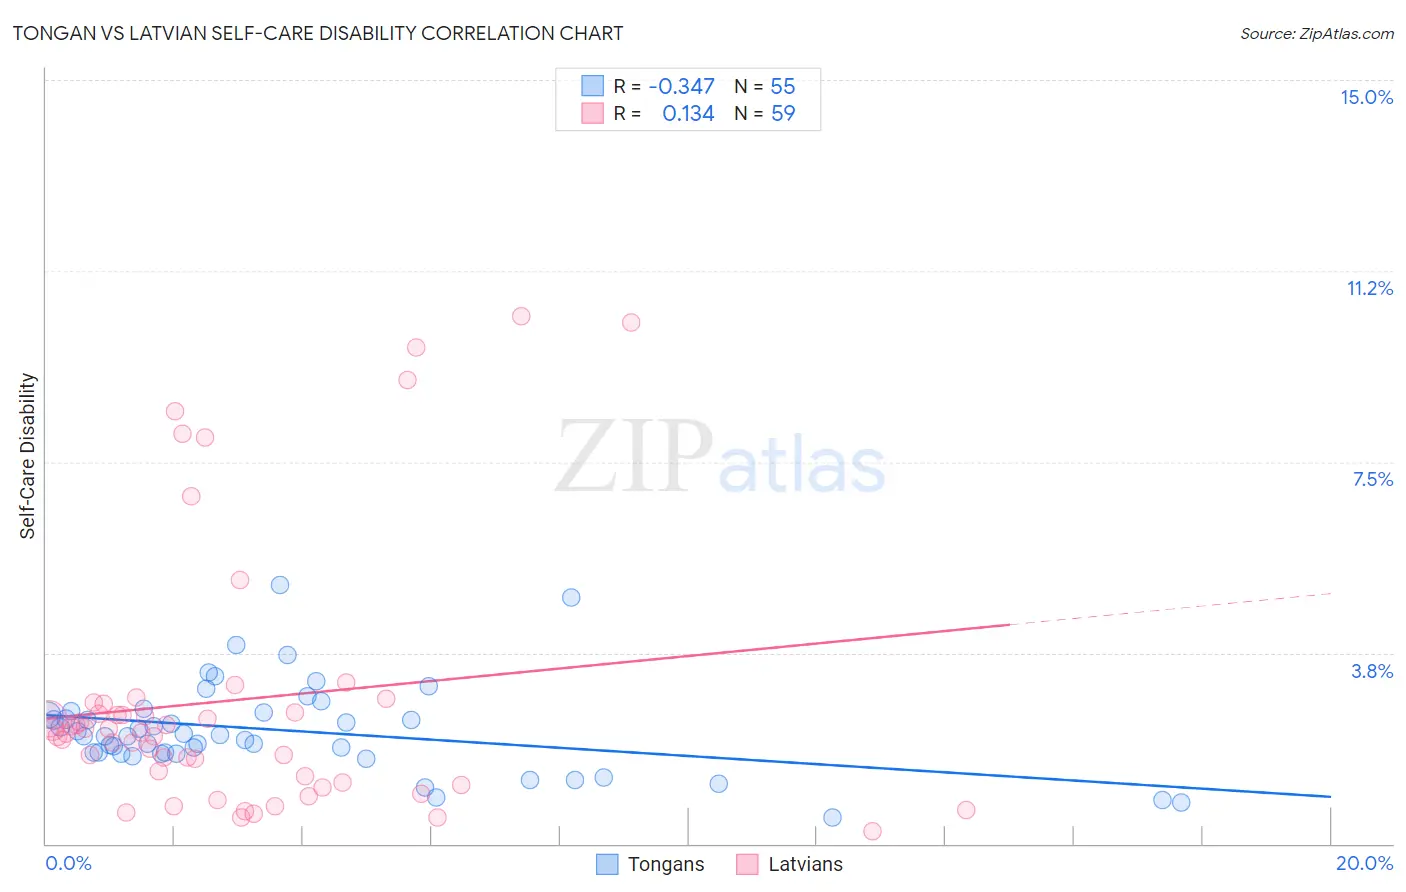
Tongan vs Latvian Self-Care Disability Correlation Chart
The statistical analysis conducted on geographies consisting of 102,855,608 people shows a mild negative correlation between the proportion of Tongans and percentage of population with self-care disability in the United States with a correlation coefficient (R) of -0.347 and weighted average of 2.2%. Similarly, the statistical analysis conducted on geographies consisting of 220,536,730 people shows a poor positive correlation between the proportion of Latvians and percentage of population with self-care disability in the United States with a correlation coefficient (R) of 0.134 and weighted average of 2.3%, a difference of 3.3%.
Self-Care Disability Correlation Summary
| Measurement | Tongan | Latvian |
| Minimum | 0.51% | 0.23% |
| Maximum | 5.1% | 10.4% |
| Range | 4.6% | 10.1% |
| Mean | 2.2% | 2.8% |
| Median | 2.1% | 2.2% |
| Interquartile 25% (IQ1) | 1.8% | 1.2% |
| Interquartile 75% (IQ3) | 2.6% | 2.8% |
| Interquartile Range (IQR) | 0.81% | 1.6% |
| Standard Deviation (Sample) | 0.89% | 2.6% |
| Standard Deviation (Population) | 0.88% | 2.6% |
Similar Demographics by Self-Care Disability
Demographics Similar to Tongans by Self-Care Disability
In terms of self-care disability, the demographic groups most similar to Tongans are Immigrants from Eritrea (2.2%, a difference of 0.080%), Bulgarian (2.2%, a difference of 0.25%), Immigrants from Venezuela (2.2%, a difference of 0.29%), Immigrants from Taiwan (2.2%, a difference of 0.41%), and Cambodian (2.2%, a difference of 0.50%).
| Demographics | Rating | Rank | Self-Care Disability |
| Ethiopians | 100.0 /100 | #13 | Exceptional 2.2% |
| Luxembourgers | 100.0 /100 | #14 | Exceptional 2.2% |
| Okinawans | 100.0 /100 | #15 | Exceptional 2.2% |
| Immigrants | Kuwait | 100.0 /100 | #16 | Exceptional 2.2% |
| Immigrants | Saudi Arabia | 100.0 /100 | #17 | Exceptional 2.2% |
| Immigrants | Taiwan | 100.0 /100 | #18 | Exceptional 2.2% |
| Immigrants | Eritrea | 100.0 /100 | #19 | Exceptional 2.2% |
| Tongans | 100.0 /100 | #20 | Exceptional 2.2% |
| Bulgarians | 100.0 /100 | #21 | Exceptional 2.2% |
| Immigrants | Venezuela | 100.0 /100 | #22 | Exceptional 2.2% |
| Cambodians | 100.0 /100 | #23 | Exceptional 2.2% |
| Cypriots | 100.0 /100 | #24 | Exceptional 2.2% |
| Turks | 100.0 /100 | #25 | Exceptional 2.2% |
| Immigrants | Sri Lanka | 99.9 /100 | #26 | Exceptional 2.2% |
| Venezuelans | 99.9 /100 | #27 | Exceptional 2.2% |
Demographics Similar to Latvians by Self-Care Disability
In terms of self-care disability, the demographic groups most similar to Latvians are Immigrants from Brazil (2.3%, a difference of 0.020%), Immigrants from Malaysia (2.3%, a difference of 0.17%), Kenyan (2.3%, a difference of 0.17%), Immigrants from Serbia (2.3%, a difference of 0.19%), and Jordanian (2.3%, a difference of 0.22%).
| Demographics | Rating | Rank | Self-Care Disability |
| Immigrants | Uganda | 99.8 /100 | #42 | Exceptional 2.3% |
| Immigrants | Pakistan | 99.8 /100 | #43 | Exceptional 2.3% |
| Immigrants | South Africa | 99.8 /100 | #44 | Exceptional 2.3% |
| Norwegians | 99.8 /100 | #45 | Exceptional 2.3% |
| Czechs | 99.8 /100 | #46 | Exceptional 2.3% |
| Jordanians | 99.7 /100 | #47 | Exceptional 2.3% |
| Immigrants | Malaysia | 99.7 /100 | #48 | Exceptional 2.3% |
| Latvians | 99.7 /100 | #49 | Exceptional 2.3% |
| Immigrants | Brazil | 99.7 /100 | #50 | Exceptional 2.3% |
| Kenyans | 99.7 /100 | #51 | Exceptional 2.3% |
| Immigrants | Serbia | 99.6 /100 | #52 | Exceptional 2.3% |
| Australians | 99.6 /100 | #53 | Exceptional 2.3% |
| Argentineans | 99.6 /100 | #54 | Exceptional 2.3% |
| Immigrants | France | 99.6 /100 | #55 | Exceptional 2.3% |
| Immigrants | Eastern Asia | 99.6 /100 | #56 | Exceptional 2.3% |