Immigrants from Italy vs Hopi Disability Age Over 75
COMPARE
Immigrants from Italy
Hopi
Disability Age Over 75
Disability Age Over 75 Comparison
Immigrants from Italy
Hopi
45.8%
DISABILITY AGE OVER 75
99.7/ 100
METRIC RATING
53rd/ 347
METRIC RANK
52.9%
DISABILITY AGE OVER 75
0.0/ 100
METRIC RATING
331st/ 347
METRIC RANK
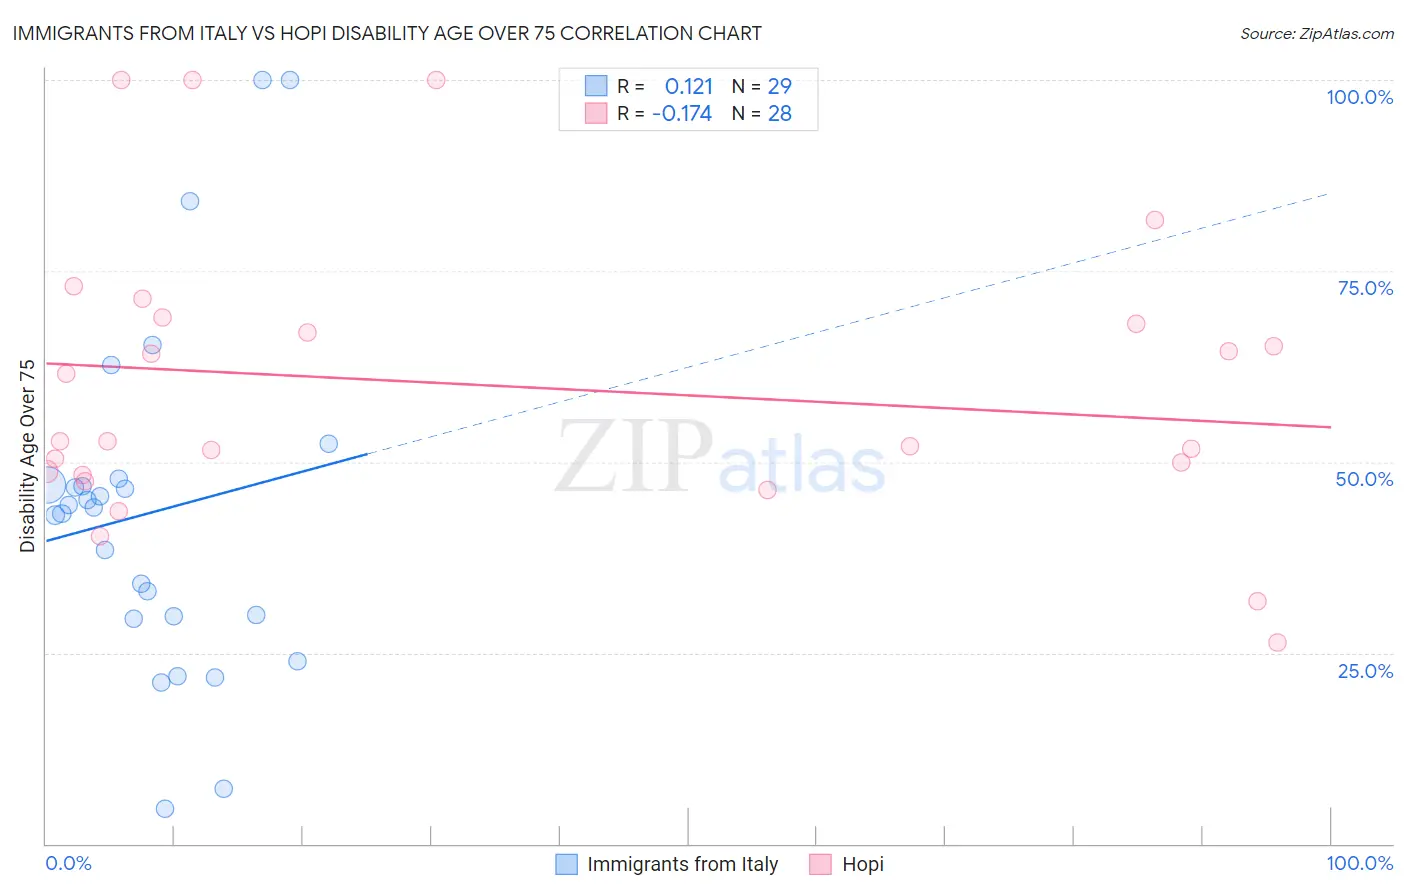
Immigrants from Italy vs Hopi Disability Age Over 75 Correlation Chart
The statistical analysis conducted on geographies consisting of 323,975,134 people shows a poor positive correlation between the proportion of Immigrants from Italy and percentage of population with a disability over the age of 75 in the United States with a correlation coefficient (R) of 0.121 and weighted average of 45.8%. Similarly, the statistical analysis conducted on geographies consisting of 74,658,865 people shows a poor negative correlation between the proportion of Hopi and percentage of population with a disability over the age of 75 in the United States with a correlation coefficient (R) of -0.174 and weighted average of 52.9%, a difference of 15.5%.
Disability Age Over 75 Correlation Summary
| Measurement | Immigrants from Italy | Hopi |
| Minimum | 4.6% | 26.4% |
| Maximum | 100.0% | 100.0% |
| Range | 95.4% | 73.6% |
| Mean | 43.4% | 60.0% |
| Median | 44.0% | 52.7% |
| Interquartile 25% (IQ1) | 29.6% | 48.5% |
| Interquartile 75% (IQ3) | 47.4% | 68.5% |
| Interquartile Range (IQR) | 17.8% | 20.0% |
| Standard Deviation (Sample) | 22.7% | 18.8% |
| Standard Deviation (Population) | 22.3% | 18.5% |
Similar Demographics by Disability Age Over 75
Demographics Similar to Immigrants from Italy by Disability Age Over 75
In terms of disability age over 75, the demographic groups most similar to Immigrants from Italy are Immigrants from France (45.8%, a difference of 0.020%), Immigrants from Korea (45.8%, a difference of 0.060%), Belgian (45.8%, a difference of 0.070%), Slovak (45.8%, a difference of 0.080%), and Maltese (45.8%, a difference of 0.080%).
| Demographics | Rating | Rank | Disability Age Over 75 |
| Swedes | 99.8 /100 | #46 | Exceptional 45.7% |
| Immigrants | Canada | 99.8 /100 | #47 | Exceptional 45.7% |
| Croatians | 99.8 /100 | #48 | Exceptional 45.7% |
| Immigrants | North America | 99.8 /100 | #49 | Exceptional 45.7% |
| Belgians | 99.7 /100 | #50 | Exceptional 45.8% |
| Immigrants | Korea | 99.7 /100 | #51 | Exceptional 45.8% |
| Immigrants | France | 99.7 /100 | #52 | Exceptional 45.8% |
| Immigrants | Italy | 99.7 /100 | #53 | Exceptional 45.8% |
| Slovaks | 99.6 /100 | #54 | Exceptional 45.8% |
| Maltese | 99.6 /100 | #55 | Exceptional 45.8% |
| Immigrants | Netherlands | 99.6 /100 | #56 | Exceptional 45.9% |
| Immigrants | Turkey | 99.6 /100 | #57 | Exceptional 45.9% |
| Immigrants | Israel | 99.6 /100 | #58 | Exceptional 45.9% |
| Iranians | 99.6 /100 | #59 | Exceptional 45.9% |
| Immigrants | Europe | 99.6 /100 | #60 | Exceptional 45.9% |
Demographics Similar to Hopi by Disability Age Over 75
In terms of disability age over 75, the demographic groups most similar to Hopi are Puerto Rican (52.9%, a difference of 0.020%), Alaska Native (52.8%, a difference of 0.19%), Native/Alaskan (53.1%, a difference of 0.29%), Choctaw (52.7%, a difference of 0.41%), and Nepalese (52.6%, a difference of 0.60%).
| Demographics | Rating | Rank | Disability Age Over 75 |
| Menominee | 0.0 /100 | #324 | Tragic 52.3% |
| Immigrants | Cabo Verde | 0.0 /100 | #325 | Tragic 52.4% |
| Ute | 0.0 /100 | #326 | Tragic 52.6% |
| Nepalese | 0.0 /100 | #327 | Tragic 52.6% |
| Choctaw | 0.0 /100 | #328 | Tragic 52.7% |
| Alaska Natives | 0.0 /100 | #329 | Tragic 52.8% |
| Puerto Ricans | 0.0 /100 | #330 | Tragic 52.9% |
| Hopi | 0.0 /100 | #331 | Tragic 52.9% |
| Natives/Alaskans | 0.0 /100 | #332 | Tragic 53.1% |
| Apache | 0.0 /100 | #333 | Tragic 53.6% |
| Alaskan Athabascans | 0.0 /100 | #334 | Tragic 54.0% |
| Kiowa | 0.0 /100 | #335 | Tragic 54.2% |
| Immigrants | Armenia | 0.0 /100 | #336 | Tragic 54.3% |
| Yuman | 0.0 /100 | #337 | Tragic 54.4% |
| Colville | 0.0 /100 | #338 | Tragic 55.4% |