Hungarian vs Hopi Disability Age Over 75
COMPARE
Hungarian
Hopi
Disability Age Over 75
Disability Age Over 75 Comparison
Hungarians
Hopi
46.5%
DISABILITY AGE OVER 75
95.3/ 100
METRIC RATING
117th/ 347
METRIC RANK
52.9%
DISABILITY AGE OVER 75
0.0/ 100
METRIC RATING
331st/ 347
METRIC RANK
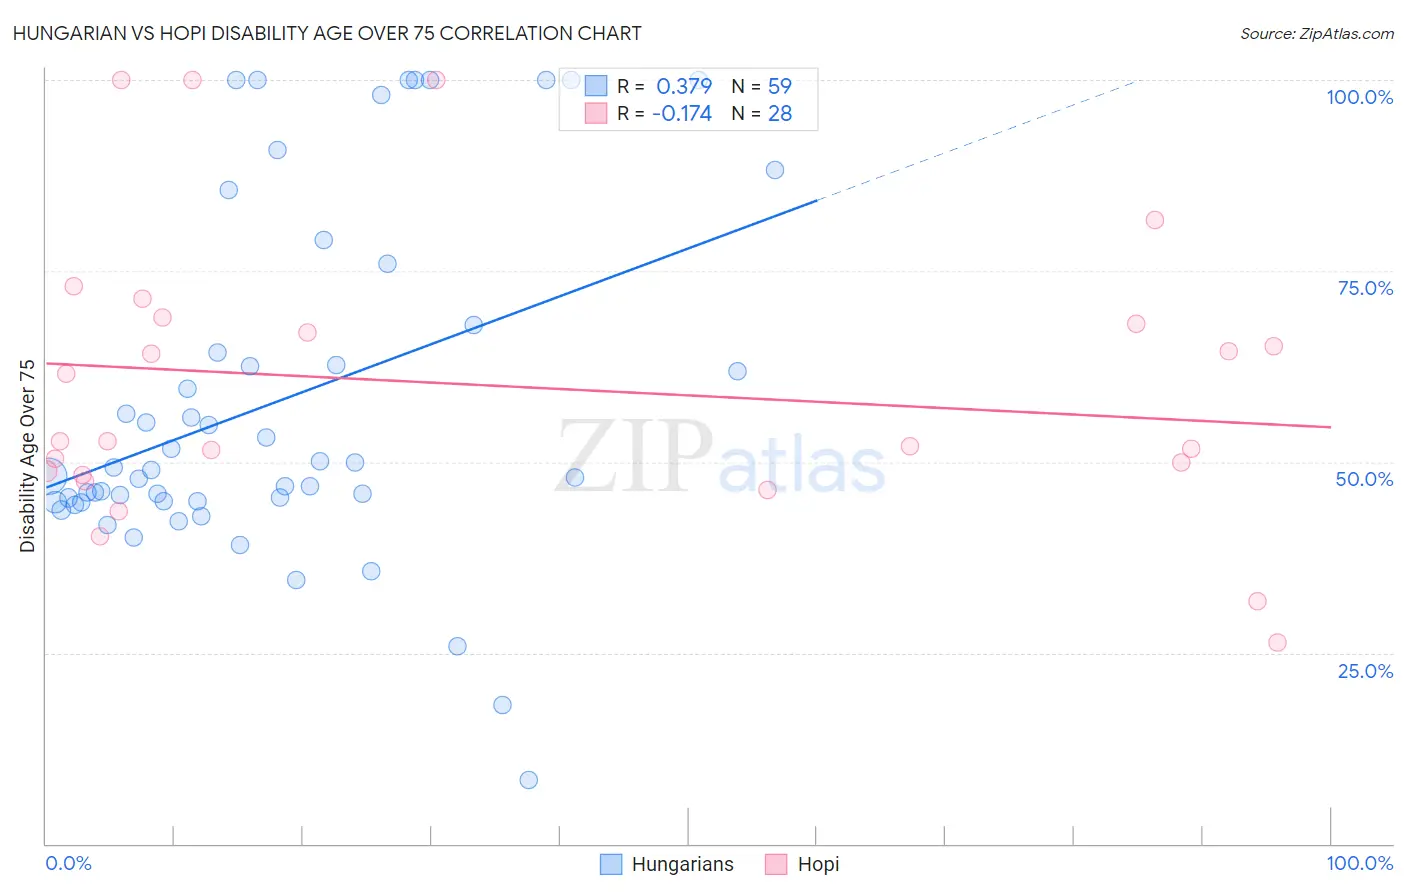
Hungarian vs Hopi Disability Age Over 75 Correlation Chart
The statistical analysis conducted on geographies consisting of 485,150,017 people shows a mild positive correlation between the proportion of Hungarians and percentage of population with a disability over the age of 75 in the United States with a correlation coefficient (R) of 0.379 and weighted average of 46.5%. Similarly, the statistical analysis conducted on geographies consisting of 74,658,865 people shows a poor negative correlation between the proportion of Hopi and percentage of population with a disability over the age of 75 in the United States with a correlation coefficient (R) of -0.174 and weighted average of 52.9%, a difference of 13.7%.
Disability Age Over 75 Correlation Summary
| Measurement | Hungarian | Hopi |
| Minimum | 8.3% | 26.4% |
| Maximum | 100.0% | 100.0% |
| Range | 91.7% | 73.6% |
| Mean | 58.0% | 60.0% |
| Median | 48.9% | 52.7% |
| Interquartile 25% (IQ1) | 44.8% | 48.5% |
| Interquartile 75% (IQ3) | 67.9% | 68.5% |
| Interquartile Range (IQR) | 23.1% | 20.0% |
| Standard Deviation (Sample) | 22.8% | 18.8% |
| Standard Deviation (Population) | 22.6% | 18.5% |
Similar Demographics by Disability Age Over 75
Demographics Similar to Hungarians by Disability Age Over 75
In terms of disability age over 75, the demographic groups most similar to Hungarians are British (46.5%, a difference of 0.060%), Indian (Asian) (46.5%, a difference of 0.060%), Dutch (46.5%, a difference of 0.080%), Czechoslovakian (46.6%, a difference of 0.080%), and Irish (46.5%, a difference of 0.10%).
| Demographics | Rating | Rank | Disability Age Over 75 |
| Immigrants | Hong Kong | 96.4 /100 | #110 | Exceptional 46.5% |
| Immigrants | Chile | 96.4 /100 | #111 | Exceptional 46.5% |
| Immigrants | Pakistan | 96.1 /100 | #112 | Exceptional 46.5% |
| Irish | 96.0 /100 | #113 | Exceptional 46.5% |
| Dutch | 95.9 /100 | #114 | Exceptional 46.5% |
| British | 95.7 /100 | #115 | Exceptional 46.5% |
| Indians (Asian) | 95.7 /100 | #116 | Exceptional 46.5% |
| Hungarians | 95.3 /100 | #117 | Exceptional 46.5% |
| Czechoslovakians | 94.7 /100 | #118 | Exceptional 46.6% |
| Canadians | 94.4 /100 | #119 | Exceptional 46.6% |
| Immigrants | Nepal | 94.1 /100 | #120 | Exceptional 46.6% |
| Scandinavians | 93.6 /100 | #121 | Exceptional 46.6% |
| Immigrants | Albania | 93.2 /100 | #122 | Exceptional 46.6% |
| Immigrants | Colombia | 92.6 /100 | #123 | Exceptional 46.7% |
| Immigrants | South America | 91.8 /100 | #124 | Exceptional 46.7% |
Demographics Similar to Hopi by Disability Age Over 75
In terms of disability age over 75, the demographic groups most similar to Hopi are Puerto Rican (52.9%, a difference of 0.020%), Alaska Native (52.8%, a difference of 0.19%), Native/Alaskan (53.1%, a difference of 0.29%), Choctaw (52.7%, a difference of 0.41%), and Nepalese (52.6%, a difference of 0.60%).
| Demographics | Rating | Rank | Disability Age Over 75 |
| Menominee | 0.0 /100 | #324 | Tragic 52.3% |
| Immigrants | Cabo Verde | 0.0 /100 | #325 | Tragic 52.4% |
| Ute | 0.0 /100 | #326 | Tragic 52.6% |
| Nepalese | 0.0 /100 | #327 | Tragic 52.6% |
| Choctaw | 0.0 /100 | #328 | Tragic 52.7% |
| Alaska Natives | 0.0 /100 | #329 | Tragic 52.8% |
| Puerto Ricans | 0.0 /100 | #330 | Tragic 52.9% |
| Hopi | 0.0 /100 | #331 | Tragic 52.9% |
| Natives/Alaskans | 0.0 /100 | #332 | Tragic 53.1% |
| Apache | 0.0 /100 | #333 | Tragic 53.6% |
| Alaskan Athabascans | 0.0 /100 | #334 | Tragic 54.0% |
| Kiowa | 0.0 /100 | #335 | Tragic 54.2% |
| Immigrants | Armenia | 0.0 /100 | #336 | Tragic 54.3% |
| Yuman | 0.0 /100 | #337 | Tragic 54.4% |
| Colville | 0.0 /100 | #338 | Tragic 55.4% |