Navajo vs Barbadian Disability Age 65 to 74
COMPARE
Navajo
Barbadian
Disability Age 65 to 74
Disability Age 65 to 74 Comparison
Navajo
Barbadians
33.3%
DISABILITY AGE 65 TO 74
0.0/ 100
METRIC RATING
343rd/ 347
METRIC RANK
24.3%
DISABILITY AGE 65 TO 74
6.0/ 100
METRIC RATING
230th/ 347
METRIC RANK
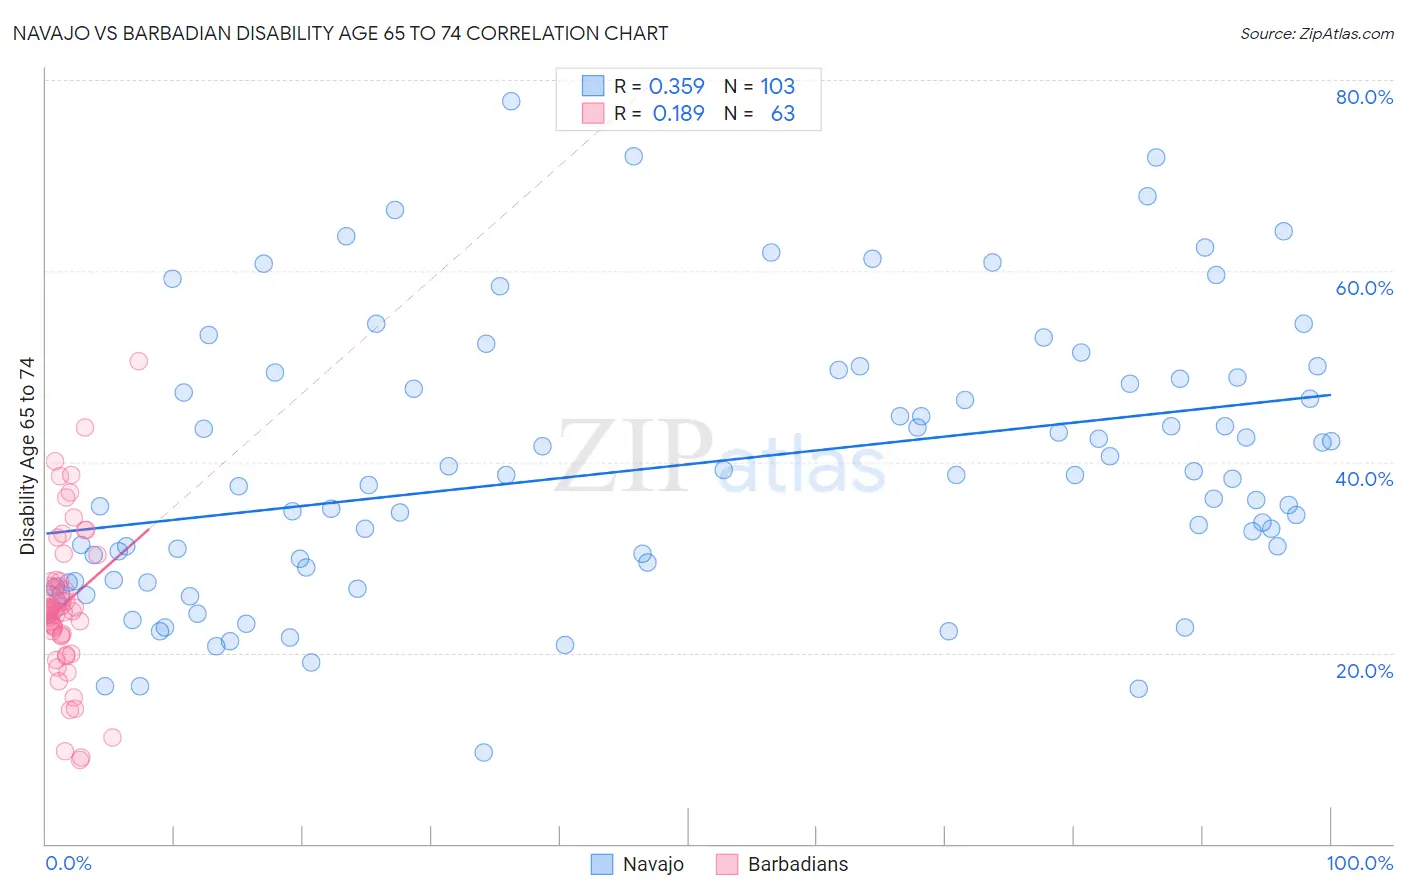
Navajo vs Barbadian Disability Age 65 to 74 Correlation Chart
The statistical analysis conducted on geographies consisting of 224,352,608 people shows a mild positive correlation between the proportion of Navajo and percentage of population with a disability between the ages 65 and 75 in the United States with a correlation coefficient (R) of 0.359 and weighted average of 33.3%. Similarly, the statistical analysis conducted on geographies consisting of 141,163,883 people shows a poor positive correlation between the proportion of Barbadians and percentage of population with a disability between the ages 65 and 75 in the United States with a correlation coefficient (R) of 0.189 and weighted average of 24.3%, a difference of 37.3%.
Disability Age 65 to 74 Correlation Summary
| Measurement | Navajo | Barbadian |
| Minimum | 9.5% | 8.8% |
| Maximum | 77.8% | 50.6% |
| Range | 68.3% | 41.8% |
| Mean | 39.5% | 25.1% |
| Median | 38.2% | 24.5% |
| Interquartile 25% (IQ1) | 27.6% | 21.9% |
| Interquartile 75% (IQ3) | 48.8% | 27.5% |
| Interquartile Range (IQR) | 21.2% | 5.6% |
| Standard Deviation (Sample) | 14.4% | 7.9% |
| Standard Deviation (Population) | 14.3% | 7.8% |
Similar Demographics by Disability Age 65 to 74
Demographics Similar to Navajo by Disability Age 65 to 74
In terms of disability age 65 to 74, the demographic groups most similar to Navajo are Pueblo (33.1%, a difference of 0.72%), Tsimshian (32.9%, a difference of 1.3%), Lumbee (32.7%, a difference of 1.9%), Kiowa (32.6%, a difference of 2.4%), and Alaskan Athabascan (32.4%, a difference of 3.0%).
| Demographics | Rating | Rank | Disability Age 65 to 74 |
| Colville | 0.0 /100 | #333 | Tragic 30.5% |
| Alaska Natives | 0.0 /100 | #334 | Tragic 30.6% |
| Cheyenne | 0.0 /100 | #335 | Tragic 31.1% |
| Yuman | 0.0 /100 | #336 | Tragic 31.5% |
| Houma | 0.0 /100 | #337 | Tragic 32.3% |
| Alaskan Athabascans | 0.0 /100 | #338 | Tragic 32.4% |
| Kiowa | 0.0 /100 | #339 | Tragic 32.6% |
| Lumbee | 0.0 /100 | #340 | Tragic 32.7% |
| Tsimshian | 0.0 /100 | #341 | Tragic 32.9% |
| Pueblo | 0.0 /100 | #342 | Tragic 33.1% |
| Navajo | 0.0 /100 | #343 | Tragic 33.3% |
| Inupiat | 0.0 /100 | #344 | Tragic 34.5% |
| Tohono O'odham | 0.0 /100 | #345 | Tragic 36.0% |
| Yup'ik | 0.0 /100 | #346 | Tragic 37.8% |
| Pima | 0.0 /100 | #347 | Tragic 38.6% |
Demographics Similar to Barbadians by Disability Age 65 to 74
In terms of disability age 65 to 74, the demographic groups most similar to Barbadians are Celtic (24.2%, a difference of 0.11%), White/Caucasian (24.2%, a difference of 0.16%), Immigrants from Thailand (24.3%, a difference of 0.20%), Immigrants from Zaire (24.3%, a difference of 0.25%), and Nigerian (24.2%, a difference of 0.40%).
| Demographics | Rating | Rank | Disability Age 65 to 74 |
| Immigrants | Middle Africa | 8.9 /100 | #223 | Tragic 24.1% |
| Immigrants | Panama | 8.6 /100 | #224 | Tragic 24.1% |
| Bermudans | 8.2 /100 | #225 | Tragic 24.2% |
| Iraqis | 8.1 /100 | #226 | Tragic 24.2% |
| Nigerians | 7.8 /100 | #227 | Tragic 24.2% |
| Whites/Caucasians | 6.6 /100 | #228 | Tragic 24.2% |
| Celtics | 6.4 /100 | #229 | Tragic 24.2% |
| Barbadians | 6.0 /100 | #230 | Tragic 24.3% |
| Immigrants | Thailand | 5.2 /100 | #231 | Tragic 24.3% |
| Immigrants | Zaire | 5.0 /100 | #232 | Tragic 24.3% |
| Bahamians | 4.5 /100 | #233 | Tragic 24.4% |
| Panamanians | 4.2 /100 | #234 | Tragic 24.4% |
| Scotch-Irish | 3.8 /100 | #235 | Tragic 24.4% |
| German Russians | 3.7 /100 | #236 | Tragic 24.4% |
| West Indians | 3.4 /100 | #237 | Tragic 24.5% |