Immigrants from Taiwan vs Danish Cognitive Disability
COMPARE
Immigrants from Taiwan
Danish
Cognitive Disability
Cognitive Disability Comparison
Immigrants from Taiwan
Danes
15.7%
COGNITIVE DISABILITY
100.0/ 100
METRIC RATING
1st/ 347
METRIC RANK
16.7%
COGNITIVE DISABILITY
98.8/ 100
METRIC RATING
91st/ 347
METRIC RANK
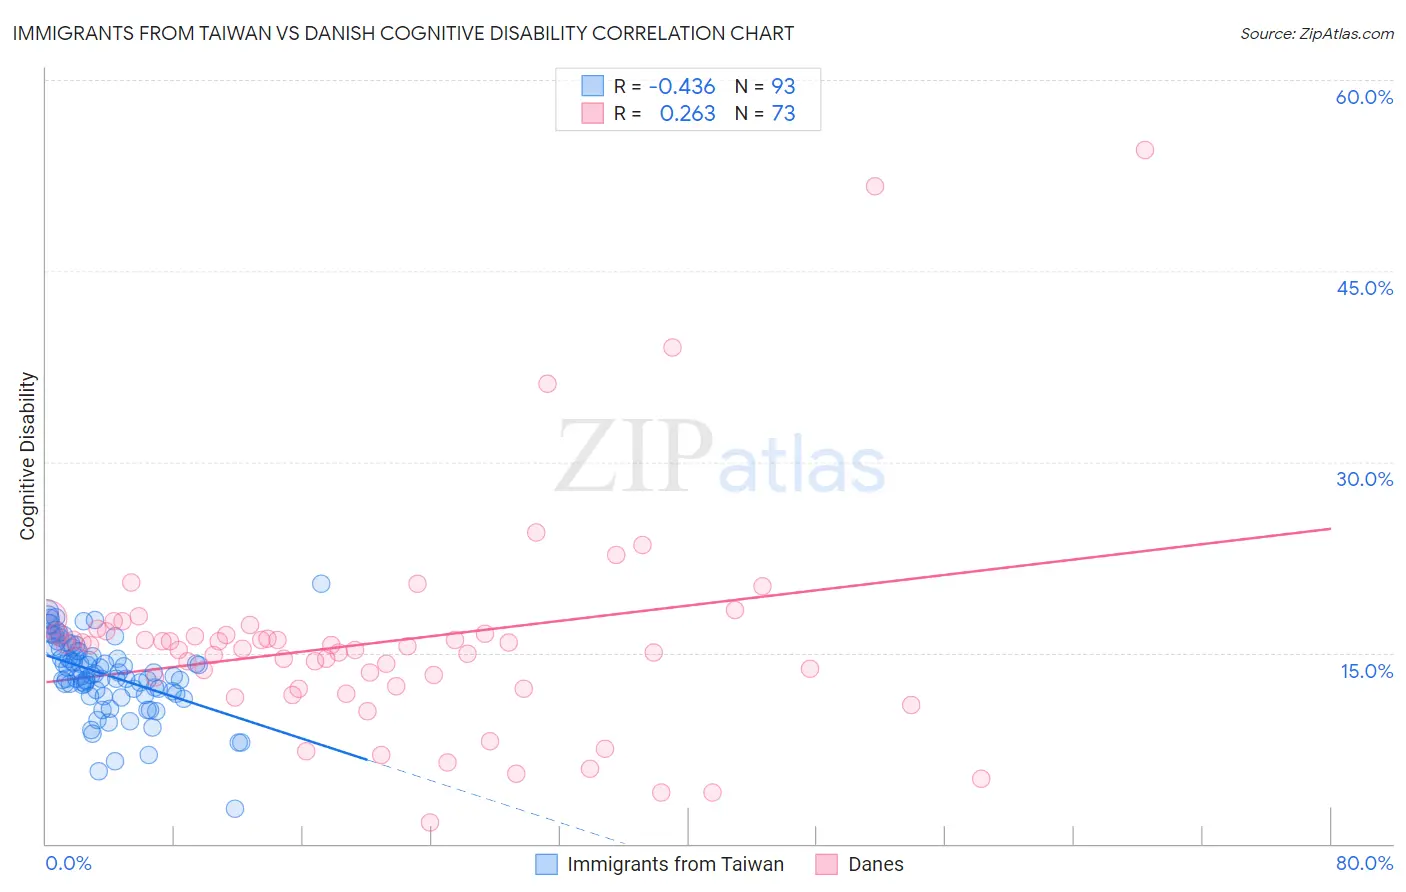
Immigrants from Taiwan vs Danish Cognitive Disability Correlation Chart
The statistical analysis conducted on geographies consisting of 298,281,408 people shows a moderate negative correlation between the proportion of Immigrants from Taiwan and percentage of population with cognitive disability in the United States with a correlation coefficient (R) of -0.436 and weighted average of 15.7%. Similarly, the statistical analysis conducted on geographies consisting of 474,128,115 people shows a weak positive correlation between the proportion of Danes and percentage of population with cognitive disability in the United States with a correlation coefficient (R) of 0.263 and weighted average of 16.7%, a difference of 6.5%.
Cognitive Disability Correlation Summary
| Measurement | Immigrants from Taiwan | Danish |
| Minimum | 2.8% | 1.7% |
| Maximum | 20.4% | 54.5% |
| Range | 17.6% | 52.9% |
| Mean | 13.3% | 15.8% |
| Median | 13.2% | 15.5% |
| Interquartile 25% (IQ1) | 11.9% | 12.3% |
| Interquartile 75% (IQ3) | 15.4% | 16.6% |
| Interquartile Range (IQR) | 3.5% | 4.3% |
| Standard Deviation (Sample) | 3.0% | 8.6% |
| Standard Deviation (Population) | 3.0% | 8.6% |
Similar Demographics by Cognitive Disability
Demographics Similar to Immigrants from Taiwan by Cognitive Disability
In terms of cognitive disability, the demographic groups most similar to Immigrants from Taiwan are Immigrants from India (15.9%, a difference of 1.3%), Chinese (15.9%, a difference of 1.3%), Immigrants from Lithuania (16.0%, a difference of 1.5%), Immigrants from Hong Kong (16.0%, a difference of 1.9%), and Thai (16.1%, a difference of 2.6%).
| Demographics | Rating | Rank | Cognitive Disability |
| Immigrants | Taiwan | 100.0 /100 | #1 | Exceptional 15.7% |
| Immigrants | India | 100.0 /100 | #2 | Exceptional 15.9% |
| Chinese | 100.0 /100 | #3 | Exceptional 15.9% |
| Immigrants | Lithuania | 100.0 /100 | #4 | Exceptional 16.0% |
| Immigrants | Hong Kong | 100.0 /100 | #5 | Exceptional 16.0% |
| Thais | 100.0 /100 | #6 | Exceptional 16.1% |
| Immigrants | Ireland | 100.0 /100 | #7 | Exceptional 16.1% |
| Immigrants | Poland | 100.0 /100 | #8 | Exceptional 16.1% |
| Assyrians/Chaldeans/Syriacs | 100.0 /100 | #9 | Exceptional 16.2% |
| Immigrants | Scotland | 100.0 /100 | #10 | Exceptional 16.2% |
| Immigrants | Czechoslovakia | 100.0 /100 | #11 | Exceptional 16.2% |
| Maltese | 100.0 /100 | #12 | Exceptional 16.2% |
| Lithuanians | 100.0 /100 | #13 | Exceptional 16.3% |
| Immigrants | Austria | 100.0 /100 | #14 | Exceptional 16.3% |
| Immigrants | Greece | 100.0 /100 | #15 | Exceptional 16.3% |
Demographics Similar to Danes by Cognitive Disability
In terms of cognitive disability, the demographic groups most similar to Danes are Immigrants from Egypt (16.7%, a difference of 0.010%), South American (16.7%, a difference of 0.010%), Immigrants from South America (16.7%, a difference of 0.010%), Immigrants from Southern Europe (16.7%, a difference of 0.020%), and Asian (16.7%, a difference of 0.060%).
| Demographics | Rating | Rank | Cognitive Disability |
| Belgians | 99.1 /100 | #84 | Exceptional 16.7% |
| Immigrants | Moldova | 99.1 /100 | #85 | Exceptional 16.7% |
| Immigrants | South Africa | 99.0 /100 | #86 | Exceptional 16.7% |
| Native Hawaiians | 99.0 /100 | #87 | Exceptional 16.7% |
| Immigrants | Philippines | 99.0 /100 | #88 | Exceptional 16.7% |
| Immigrants | Egypt | 98.8 /100 | #89 | Exceptional 16.7% |
| South Americans | 98.8 /100 | #90 | Exceptional 16.7% |
| Danes | 98.8 /100 | #91 | Exceptional 16.7% |
| Immigrants | South America | 98.8 /100 | #92 | Exceptional 16.7% |
| Immigrants | Southern Europe | 98.7 /100 | #93 | Exceptional 16.7% |
| Asians | 98.7 /100 | #94 | Exceptional 16.7% |
| English | 98.6 /100 | #95 | Exceptional 16.8% |
| Finns | 98.5 /100 | #96 | Exceptional 16.8% |
| Dutch | 98.5 /100 | #97 | Exceptional 16.8% |
| Immigrants | Lebanon | 98.4 /100 | #98 | Exceptional 16.8% |